You'll be re-directed to the Institutional Investor site.
To see the forest, we study the trees. We believe the most insightful top-down views come from stitching together bottom-up research of individual companies and securities and analysis grounded in valuation. This fundamental approach is the anchor for our asset allocation views. As patterns emerge across sectors and regions, they sharpen our perspectives on relative opportunities.
In this paper, we share our current insights on the relative attractiveness of asset classes in our investment universe and portfolio positioning considerations.
U.S. Equities: High Market Concentration and Full Valuations
A handful of mega-cap technology and communications companies, boosted by excitement around artificial intelligence, have driven U.S. equity market returns since the end of 2023. NVIDIA, Apple, Microsoft, Alphabet, and Amazon—the S&P 500’s five largest constituents—now collectively account for 30.2% of the Index, and their combined market value exceeds the stock market capitalization of every country except the U.S. and China.1 This concentration heightens risk in passive portfolios, as setbacks in a few dominant names could disproportionately impact the Index’s performance.
In addition, the overall U.S. equity market is expensive across multiple valuation metrics, suggesting future Index returns may be more modest (see Figure 1). Since 1945, the three-year annualized returns for the S&P 500 after starting from a trailing operating P/E ratio in the current 25-27x range have spanned from -16.1% to 14.6%.
Figure 1. Higher Starting Valuations Have Historically Meant Lower Subsequent Returns2

Source: Bloomberg Index Services, S&P. Dodge & Cox calculated the percentages based on trailing operating price-to-earnings ratios in the current 25-27x range. The S&P 500's operating P/E was 26.0x on December 31, 2025.
In the past, the capital-light nature of many software and technology businesses, together with the view that many of their investments should be capitalized rather than expensed, made a credible argument that their earnings quality was high and justified higher P/E multiples. Today, given the higher capital intensity and lower revenue and profit certainty associated with AI investments, this no longer appears to be the case. In spite of, and in part due to, these characteristics of the broader market, we believe value-oriented, active portfolios have the potential to outperform.
Portfolio Positioning Considerations
- Focusing on identifying attractively valued U.S. stocks: We’re still finding pockets of value in U.S. markets, but they tend to be in less cyclical sectors—such as Health Care, Consumer Staples, and Utilities—where earnings are more stable and stocks are more reasonably priced.
- Mitigating risk: Smart portfolio construction includes risk control. By avoiding concentrated, expensive areas of the market and exposure to excessive leverage, we seek to minimize major drawdowns—an effect that can be as powerful over time as capturing gains in bull markets.
- Hedging broad U.S. equity market exposure: Given the U.S. equity market's high valuations and heavy concentration in a few mega-cap stocks, for example, our Balanced Fund held a short position in S&P 500 futures on September 30. This position is intended to reduce the portfolio's sensitivity to a broad market decline (i.e., lower its beta) while retaining exposure to the specific securities we believe can outperform.
International Equities: Global Diversifiers at Favorable Relative Valuations
Earlier last year, we made The Case for International Equities and continue to find many opportunities there. International equities, broadly speaking, are trading at a substantial discount to U.S. equities (see Figure 2). This market provides access to different growth drivers and broader, more diverse sector and regional exposures than today’s concentrated U.S. equity market. In addition, governments around the world are implementing policies—such as the Tokyo Stock Exchange’s capital efficiency push in Japan, China’s “Market Value Management” framework, and Korea’s “Market Value Up” program—that sharpen capital returns and governance and boost long-term potential returns.
Figure 2. International Equities Are Trading at a Large Discount to U.S. Equities

Source: FactSet, MSCI, S&P. Monthly data from December 31, 2005 to December 31, 2025.
The pronounced weakening of the U.S. dollar in 2025 further strengthens the case for international equities overall, as a softer dollar can boost returns on foreign holdings and enhance the diversification benefits of investing abroad. Importantly, as discussed further below, the U.S. dollar still looks expensive on most metrics when compared to a basket of other currencies, suggesting the currency tailwinds for international equities could continue.
At 13.5x forward earnings, emerging market stocks look particularly compelling and offer access to higher growth potential than many developed markets due to their rapid urbanization, expanding middle class, and large, young workforce.3 Technological innovation in consumer applications, such as mobile banking, is a powerful driver in both emerging and developed markets and supports strong corporate earnings growth over time. Since their return patterns often differ from those of U.S. and other developed world stocks, emerging market equities can aid diversification, help reduce overall portfolio correlation, and potentially smooth long-term volatility.
International investing carries real risks, including currency fluctuations, geopolitical uncertainty, and the complexities of different regulatory environments. We don't dismiss these. But we believe many international stocks are priced attractively enough to offset these risks—an opportunity that's harder to find in the U.S. today.
Portfolio Positioning Considerations
- Looking to invest internationally in equities: As shown by our Global Stock Fund’s exposures in Figure 3, we’re finding more non-U.S. companies with stock prices that we believe don’t fully reflect the underlying business quality. Examples include: European banks trading below book value despite improved capital positions, Japanese manufacturers benefiting from governance reforms that are finally unlocking shareholder value, and emerging market companies in Asia and Latin America where structural reforms have made businesses more competitive.
- Being mindful of currency exposure: We believe the U.S. dollar remains expensive vs. history and is likely to weaken in the coming years. To reduce unwanted foreign exchange risk, stabilize portfolio returns, and focus more on the underlying performance of the securities than currency movements, we hedge currencies on a case-by-case basis.
Figure 3. The Global Stock Fund Has Higher Exposure to International Equities

Source: Dodge & Cox. Data excludes cash and is as of September 30, 2025.
Fixed Income: Appealing Return Prospects, but Credit Spreads Are Tight
The U.S. fixed income outlook is stronger than in past years given positive real yields, lower inflation, and looser monetary policy. As front-end yields have declined, the attractiveness of fixed income vs. cash or money-market investments has increased. Starting yields have historically been a reliable predictor of future returns. Figure 4 illustrates this relationship well. Today's starting yield of 4.3% for the Bloomberg U.S. Aggregate Bond Index is attractive by historical standards and provides a buffer against price volatility from interest rate changes.4
Figure 4. Fixed Income Yields Are Attractive5
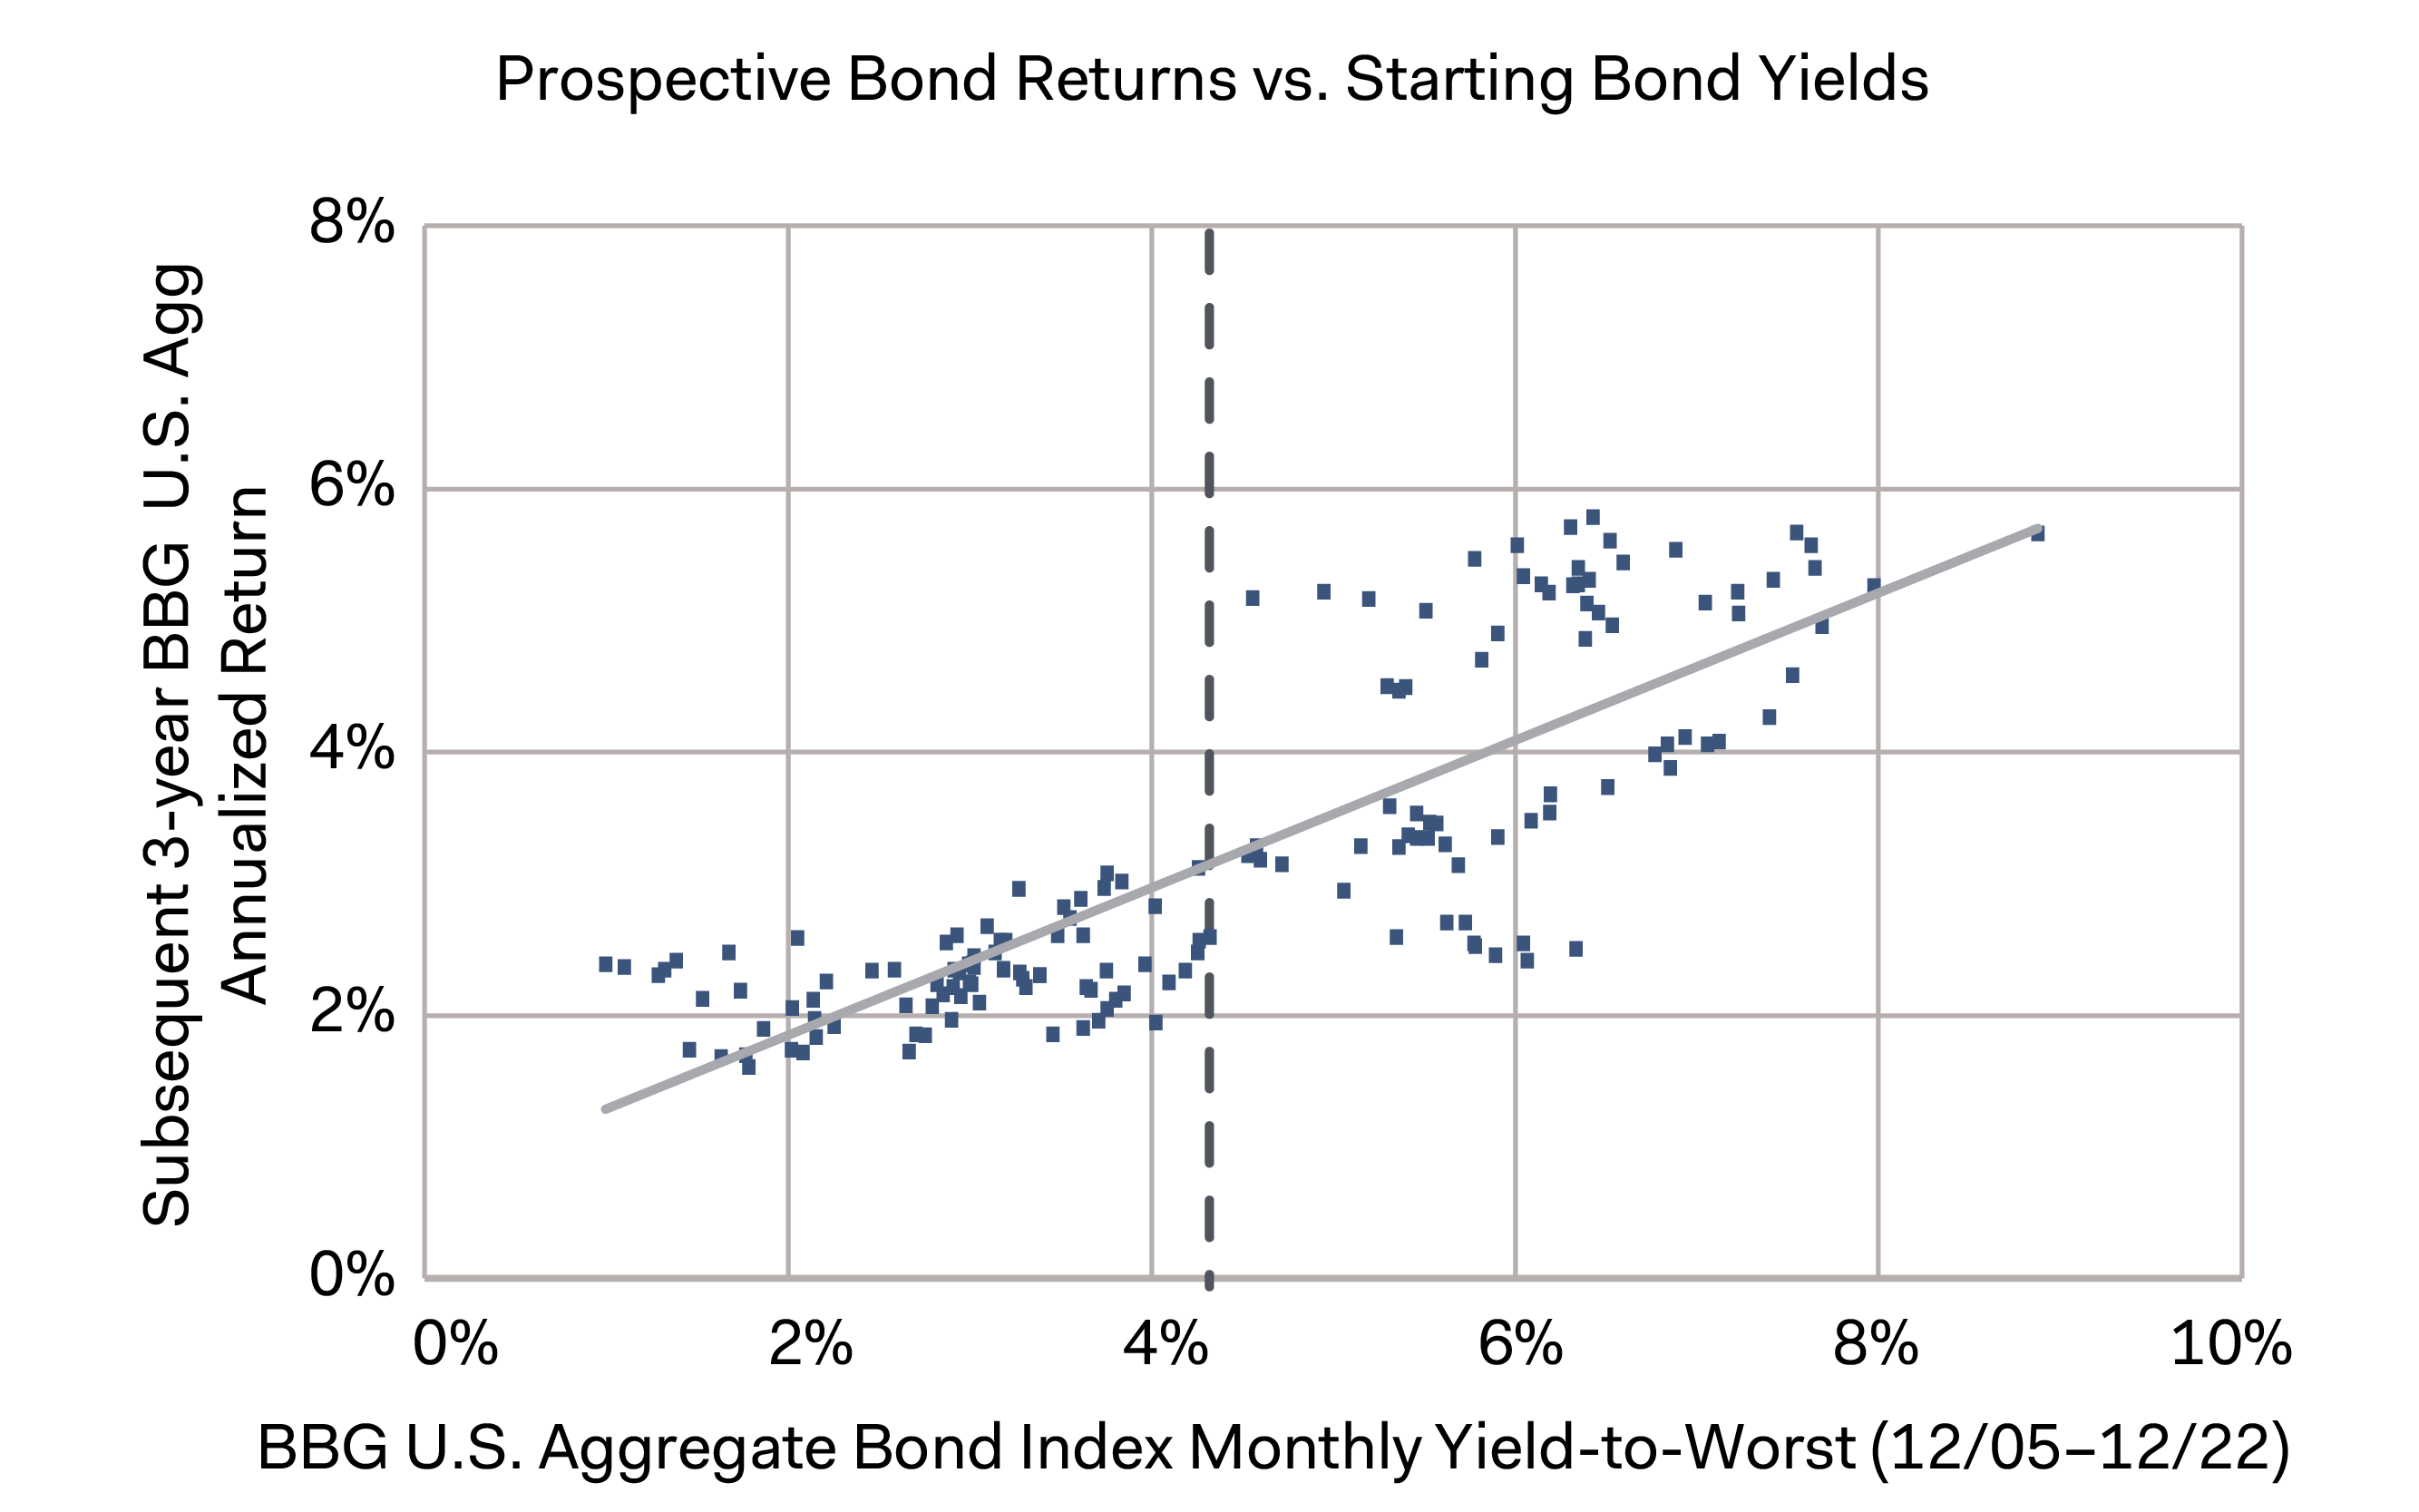
Source: Bloomberg Index Services.
Within bond market sectors, we’d note that credit spreads hover near their tightest levels in decades, amid healthy corporate fundamentals and ongoing investor demand for income. In corporate credit, the perceived current safety implied by tight spreads may not match the future reality. For example, bond investors have seen volatility in the last year from changes in tariff policies, geopolitical developments, and softer U.S. economic growth. This environment argues for continued care and discipline in fixed income allocations rather than chasing yield where investors aren’t compensated for risk.
Beyond the United States, the U.S. dollar’s recent weakness has prompted investors to consider adding non-dollar exposure to their fixed income allocations. We agree that global fixed income looks attractive today. We recently wrote Global Bonds: Navigating a Weaker Dollar, encouraging a careful approach to currency positioning to deliver successful long-term outcomes for investors.
Portfolio Positioning Considerations
- Utilizing bonds as sources of stability and income: The combination of higher starting yields and pockets of opportunity across sectors presents a favorable return outlook for long-term bond investors.
- Being selective in credit: Given tight credit spreads, a discerning approach remains essential. Currently, we’re focusing on shorter and intermediate-dated maturities to reduce price sensitivity if and when spreads widen. We are emphasizing issuers with durable business models and sound balance sheets.
- Investing in securitized assets: We're finding interesting opportunities in securitized markets—Agency6 mortgage-backed securities and high-quality asset-backed securities—where we believe yields more than compensate investors for the underlying risks.
- Rebalancing from the richest segments of the market: With wide valuation differentials across asset classes and regions, rebalancing is an essential discipline for investors. Motivated by more compelling yields in fixed income and less attractive prospective U.S. equity returns, our Balanced Fund has a historically higher allocation to fixed income and lower overall net equity weight.7 Within equities, we increased the portfolio’s exposure to developed international and emerging market equities.
- Analyzing correlation and portfolio construction: Balanced investors generally benefit from a neutral—or even negative—correlation between U.S. stocks and bonds. However, in periods of elevated inflation—such as 2022—stocks and bond prices can move more in tandem. It’s beneficial to identify less correlated assets that are expected to perform better during periods of inflation, such as Treasury inflation-protected securities (TIPS).
A Framework for Reviewing Existing Allocations
In closing, we suggest evaluating current portfolios through three lenses:
- Concentration Audit: Has passive U.S. equity exposure drifted toward unintended concentration? Even investors bullish on mega-cap technology should confirm the weighting matches their actual risk tolerance.
- Relative Valuation Check: Valuation differentials are wide across regions. For portfolios that have appreciated with U.S. markets, this may argue for rebalancing toward areas with more attractive starting valuations.
- Risk Tolerance Assesment: Does the portfolio’s expected downside still align with the investor’s capacity and willingness to take risk? Stress tests and scenario analysis can help mitigate risk and provide signals to adjust portfolio exposures.
We welcome the opportunity to discuss these perspectives and how our actively managed strategies can help you and/or your clients achieve your long-term objectives.
Balanced Fund’s Top Ten Equity Holdings (as of September 30, 2025): CVS Health Corp. (2.5% of the Fund), The Charles Schwab Corp. (2.3%), Alphabet, Inc. (1.9%), Fiserv, Inc. (1.8%), GSK PLC (1.6%), RTX Corp. (1.6%), Occidental Petroleum Corp. (1.4%), Wells Fargo & Co. (1.2%), Taiwan Semiconductor Manufacturing Co., Ltd. (1.2%), and Microsoft Corp. (1.1%). Top Ten Fixed Income Issuers (as of September 30, 2025): Fannie Mae (6.1% of the Fund), Freddie Mac (5.6%), U.S. Treasury Note/Bond (5.4%), Ginnie Mae (1.8%), Navient Student Loan Trust (0.8%), British American Tobacco PLC (0.8%), Petroleos Mexicanos (0.7%), Citigroup, Inc. (0.7%), Ford Motor Credit Co. LLC (0.5%), and Charter Communications, Inc. (0.5%).
Disclosures
Before investing in any Dodge & Cox Fund, you should carefully consider the Fund’s investment objectives, risks, and charges and expenses. To obtain a Fund’s prospectus and summary prospectus, which contain this and other important information, visit dodgeandcox.com or call 800-621-3979. Please read the prospectus and summary prospectus carefully before investing.
The above information is not a complete analysis of every material fact concerning any market, industry, or investment. Data has been obtained from sources considered reliable, but Dodge & Cox makes no representations as to the completeness or accuracy of such information. Opinions expressed are subject to change without notice. The above returns represent past performance and do not guarantee future results. Dodge & Cox does not seek to replicate the returns of any index. The actual returns of a Dodge & Cox managed portfolio may differ materially from the returns shown above. The information provided is historical and does not predict future results or profitability. This is not a recommendation to buy, sell, or hold any security and is not indicative of Dodge & Cox’s current or future trading activity. Diversification does not ensure a profit or guarantee against losses. All Dodge & Cox trademarks are owned by Dodge & Cox and its affiliates. All other company and product names mentioned are the trademarks or registered trademarks of their respective companies. This information should not be considered a solicitation or an offer to purchase or sell any securities in any jurisdiction or a solicitation or an offer to provide any services in any jurisdiction.
The MSCI information may only be used for your internal use, may not be reproduced or redisseminated in any form and may not be used as a basis for or a component of any financial instruments or products or indices. None of the MSCI information is intended to constitute investment advice or a recommendation to make (or refrain from making) any kind of investment decision and may not be relied on as such. Historical data and analysis should not be taken as an indication or guarantee of any future performance analysis, forecast or prediction. The MSCI Information is provided on an “as is” basis and the user of this information assumes the entire risk of any use made of this information. MSCI, each of its affiliates and each other person involved in or related to compiling, computing or creating any MSCI information (collectively, the “MSCI Parties”) expressly disclaims all warranties (including, without limitation, any warranties of originality, accuracy, completeness, timeliness, non-infringement, merchantability and fitness for a particular purpose) with respect to this information. Without limiting any of the foregoing, in no event shall any MSCI Party have any liability for any direct, indirect, special, incidental, punitive, consequential (including, without limitation, lost profits) or any other damages. MSCI® , EAFE® , and ACWI® are trademarks of MSCI, Inc. (www.msci.com)
The S&P 500 Index (“Index”) and associated data are a product of S&P Dow Jones Indices LLC, its affiliates and/or their licensors and has been licensed for use by Dodge & Cox. © 2026 S&P Dow Jones Indices LLC, its affiliates and/or their licensors. All rights reserved. Redistribution or reproduction in whole or in part are prohibited without written permission of S&P Dow Jones Indices LLC. For more information on any of S&P Dow Jones Indices LLC’s indices please visit www.spdji.com. S&P® is a registered trademark of Standard & Poor’s Financial Services LLC (“SPFS”) and Dow Jones® is a registered trademark of Dow Jones Trademark Holdings LLC (“Dow Jones”). Neither S&P Dow Jones Indices LLC, SPFS, Dow Jones, their affiliates nor their licensors (“S&P DJI”) make any representation or warranty, express or implied, as to the ability of any index to accurately represent the asset class or market sector that it purports to represent and S&P DJI shall have no liability for any errors, omissions, or interruptions of any index or the data included therein.
BLOOMBERG® is a trademark and service mark of Bloomberg Finance, L.P. and its affiliates (collectively “Bloomberg”). BARCLAYS® is a trademark and service mark of Barclays Bank Plc (collectively with its affiliates, “Barclays”), used under license. Bloomberg or Bloomberg’s licensors, including Barclays, own all proprietary rights in the Bloomberg Indices. Neither Bloomberg nor Barclays approves or endorses this material, or guarantees the accuracy or completeness of any information herein or makes any warranty, express or implied, as to the results to be obtained therefrom and, to the maximum extent allowed by law, neither shall have any liability or responsibility for injury or damages arising in connection therewith.
Dodge & Cox Funds are distributed by Foreside Fund Services, LLC, which is not affiliated with Dodge & Cox.
See Disclosures for a full list of financial terms and Index definitions.
Endnotes
1. Unless otherwise specified, all Index weightings and characteristics are as of December 31, 2025.
2. Graph shows P/E with subsequent three-year annualized total returns, rolling monthly. S&P 500 equity analysis uses trailing operating earnings from December 31, 1944 through December 31, 2022, with the first three-year period ending December 31, 1947 and the final ending December 31, 2025. The illustration does not reflect the returns of any Dodge & Cox Fund or client account, and Dodge & Cox does not seek to replicate the returns of any index. Past performance is no guarantee of future returns.
3. The MSCI Emerging Markets Index traded at 13.5x forward earnings on December 31, 2025.
4. Measured by the Index’s yield to worst, the lowest possible yield that can be received on a bond with an early retirement provision. It assumes the bond is paid off at the earliest date allowed by its terms, such as through a call or early redemption.
5. Graph shows yield with subsequent three-year annualized total returns, rolling monthly. Bond analysis uses the Bloomberg U.S. Aggregate Bond Index’s yield-to-worst from January 31, 1976 through December 31, 2022, with the first three-year period ending January 31, 1979 and the final ending December 31, 2025. The illustration does not reflect the returns of any Dodge & Cox Fund or client account, and Dodge & Cox does not seek to replicate the returns of any index. Past performance is no guarantee of future returns.
6. The U.S. Government does not guarantee the Fund’s shares, yield, or net asset value. The agency guarantee (by, for example, Ginnie Mae, Fannie Mae, or Freddie Mac) does not eliminate market risk.
7. Fund data is as of September 30, 2025.