You'll be re-directed to the Financial Professional site.
Key Takeaways
- In early 2025, investor enthusiasm shifted from U.S. to international equities. The substantial valuation disparity between these markets, uncertainty about new tariff policies, and a weaker U.S. dollar contributed to this reversal.
- International equities present a compelling long-term opportunity due to their attractive valuations, diversification benefits, distinct market exposures, and structural reforms aimed at boosting competitiveness.
- Skilled investors can mitigate risks and generate excess returns in international equities through fundamental research and active, value-oriented security selection. In this paper, we share a few examples of international companies we find particularly attractive.
From 2010–2024, U.S. equities outperformed international equities by 503 percentage points overall.1 International stocks outperformed in only three of those 15 years. Impressive growth from the “Magnificent Seven” stocks, a group of U.S. mega-cap technology and consumer-related companies, drove the U.S. market’s stellar returns. Robust economic growth, favorable tax policies, and a stronger U.S. dollar also boosted performance. The U.S. dollar increased 39% on a trade-weighted basis over this 15-year period, which was a major headwind for U.S. dollar-based international investors.
Based on this track record and the higher growth achieved by some innovative American companies, many investors have viewed the United States as the prime destination for superior returns. We are wary of extrapolating past performance and develop our outlook based on the relationship between fundamentals and valuation.
By the end of 2024, international equities were the cheapest they have been relative to their U.S. counterparts. While the U.S. economy started this year on solid footing, the Trump administration’s announcements of new tariffs rattled global markets and increased concerns about global economic growth, higher inflation, and the strength of the U.S. dollar. Given the deteriorating outlook and the large valuation disparity, market sentiment reversed, and international equities outperformed U.S. equities by 14 percentage points year to date through April 30.2
International companies are not shielded from these developments. We are actively evaluating trade-related impacts, retesting our investment theses for existing portfolio holdings, and adjusting portfolio exposures on a bottom-up basis as investment opportunities arise. This market environment provides active managers opportunities to identify and take advantage of mispriced stocks.
Going forward, we are optimistic about the relative long-term prospects of international equities. They remain attractively valued, offer enhanced diversification, provide a differentiated opportunity set for active managers, and could benefit from structural reforms enabling more competitiveness and shareholder orientation.
Inexpensive Relative Valuations
Starting valuations matter. History has shown they are significant drivers of long-term equity returns and that lower starting valuations are associated with higher equity returns.
International equities are trading at a historically cheap relative valuation. At the end of 2024, the valuation gap between international and U.S. stocks was at the first percentile of historical monthly observations (see Figure 1).3 The first percentile represents a trough-level relative valuation. After tariff-related volatility, this disparity rose to the eighth percentile on April 30 but remains very compelling.
Figure 1. International Equities Are Trading at a Large Discount to U.S. Equities
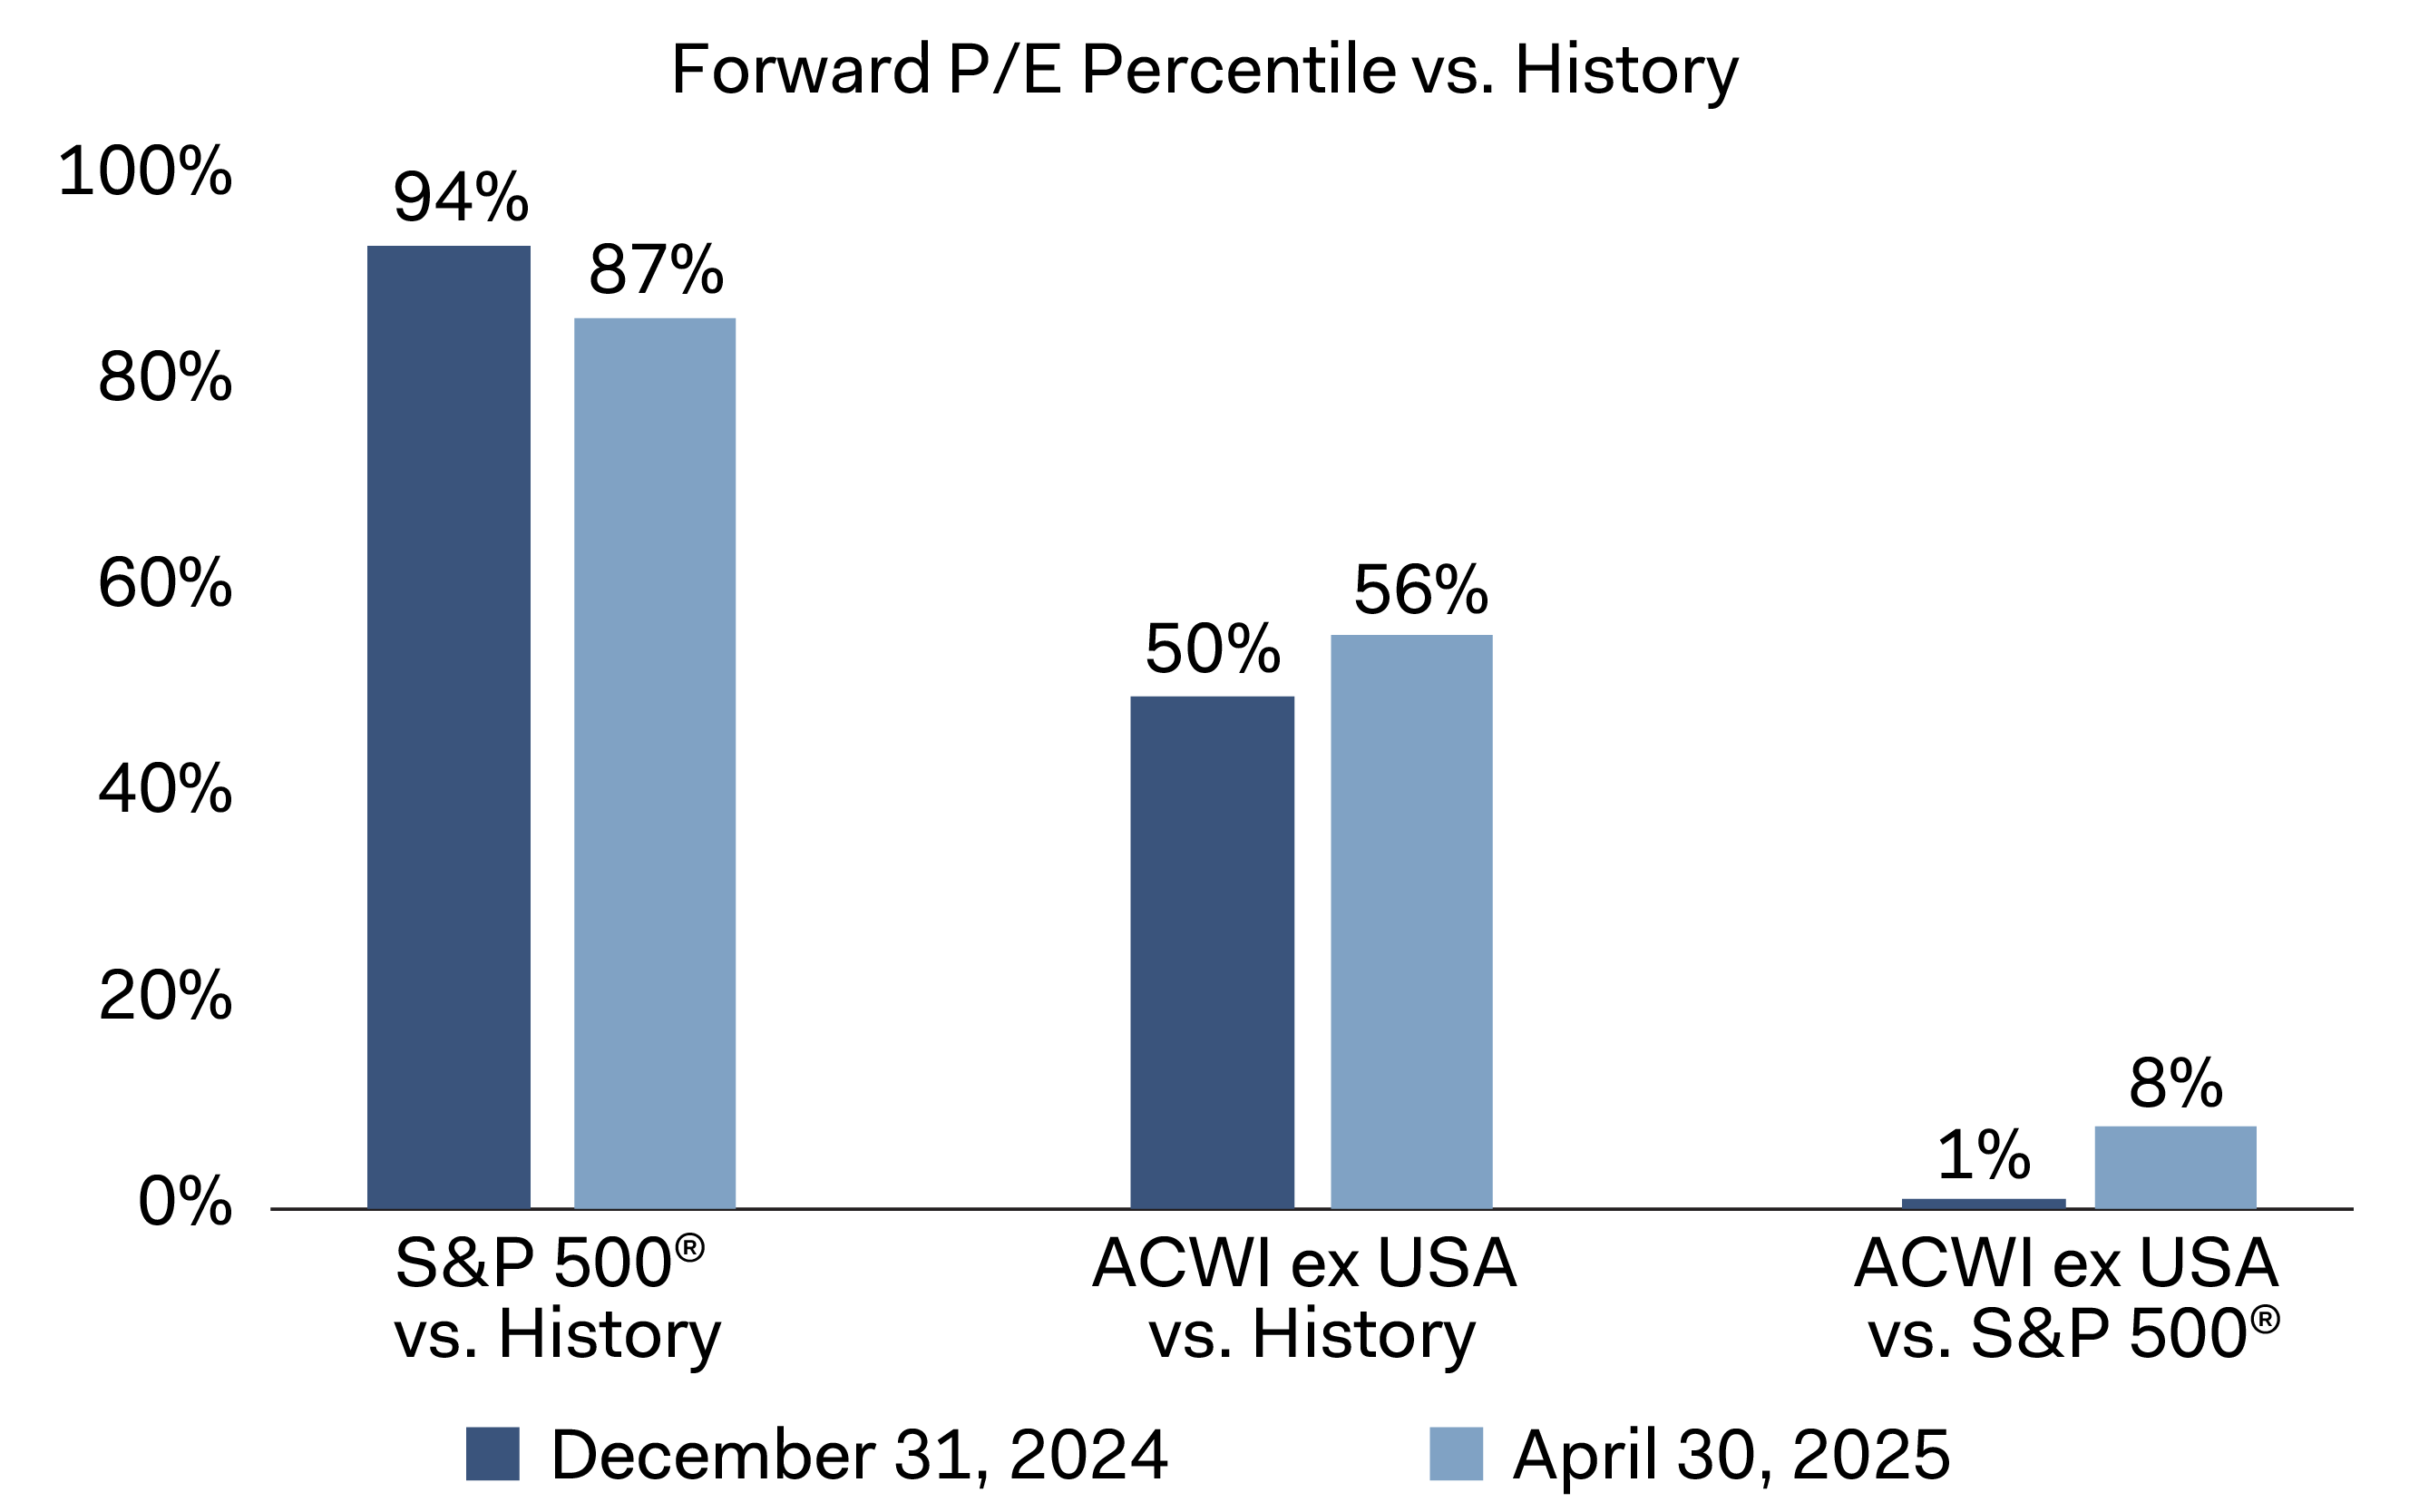
Source: FactSet, MSCI, S&P. Dodge & Cox calculated the percentiles, which are based on monthly observations since June 30, 2003.
The MSCI ACWI ex USA trades at only 13.4 times forward earnings compared to 20.9 times for the S&P 500 Index.4 At Dodge & Cox, our U.S., international, and global strategies all trade at a meaningful discount to their broader market given our active, value-oriented approach.
This valuation discount is broad-based at the sector level; most international sectors are meaningfully cheaper than their U.S. counterparts (see Figure 2). In addition, over half of international sectors trade at or below their 20-year median forward price-to-earnings ratio, whereas all U.S. sectors trade at or above this metric.
Figure 2. International’s Discount Extends Across All Sectors
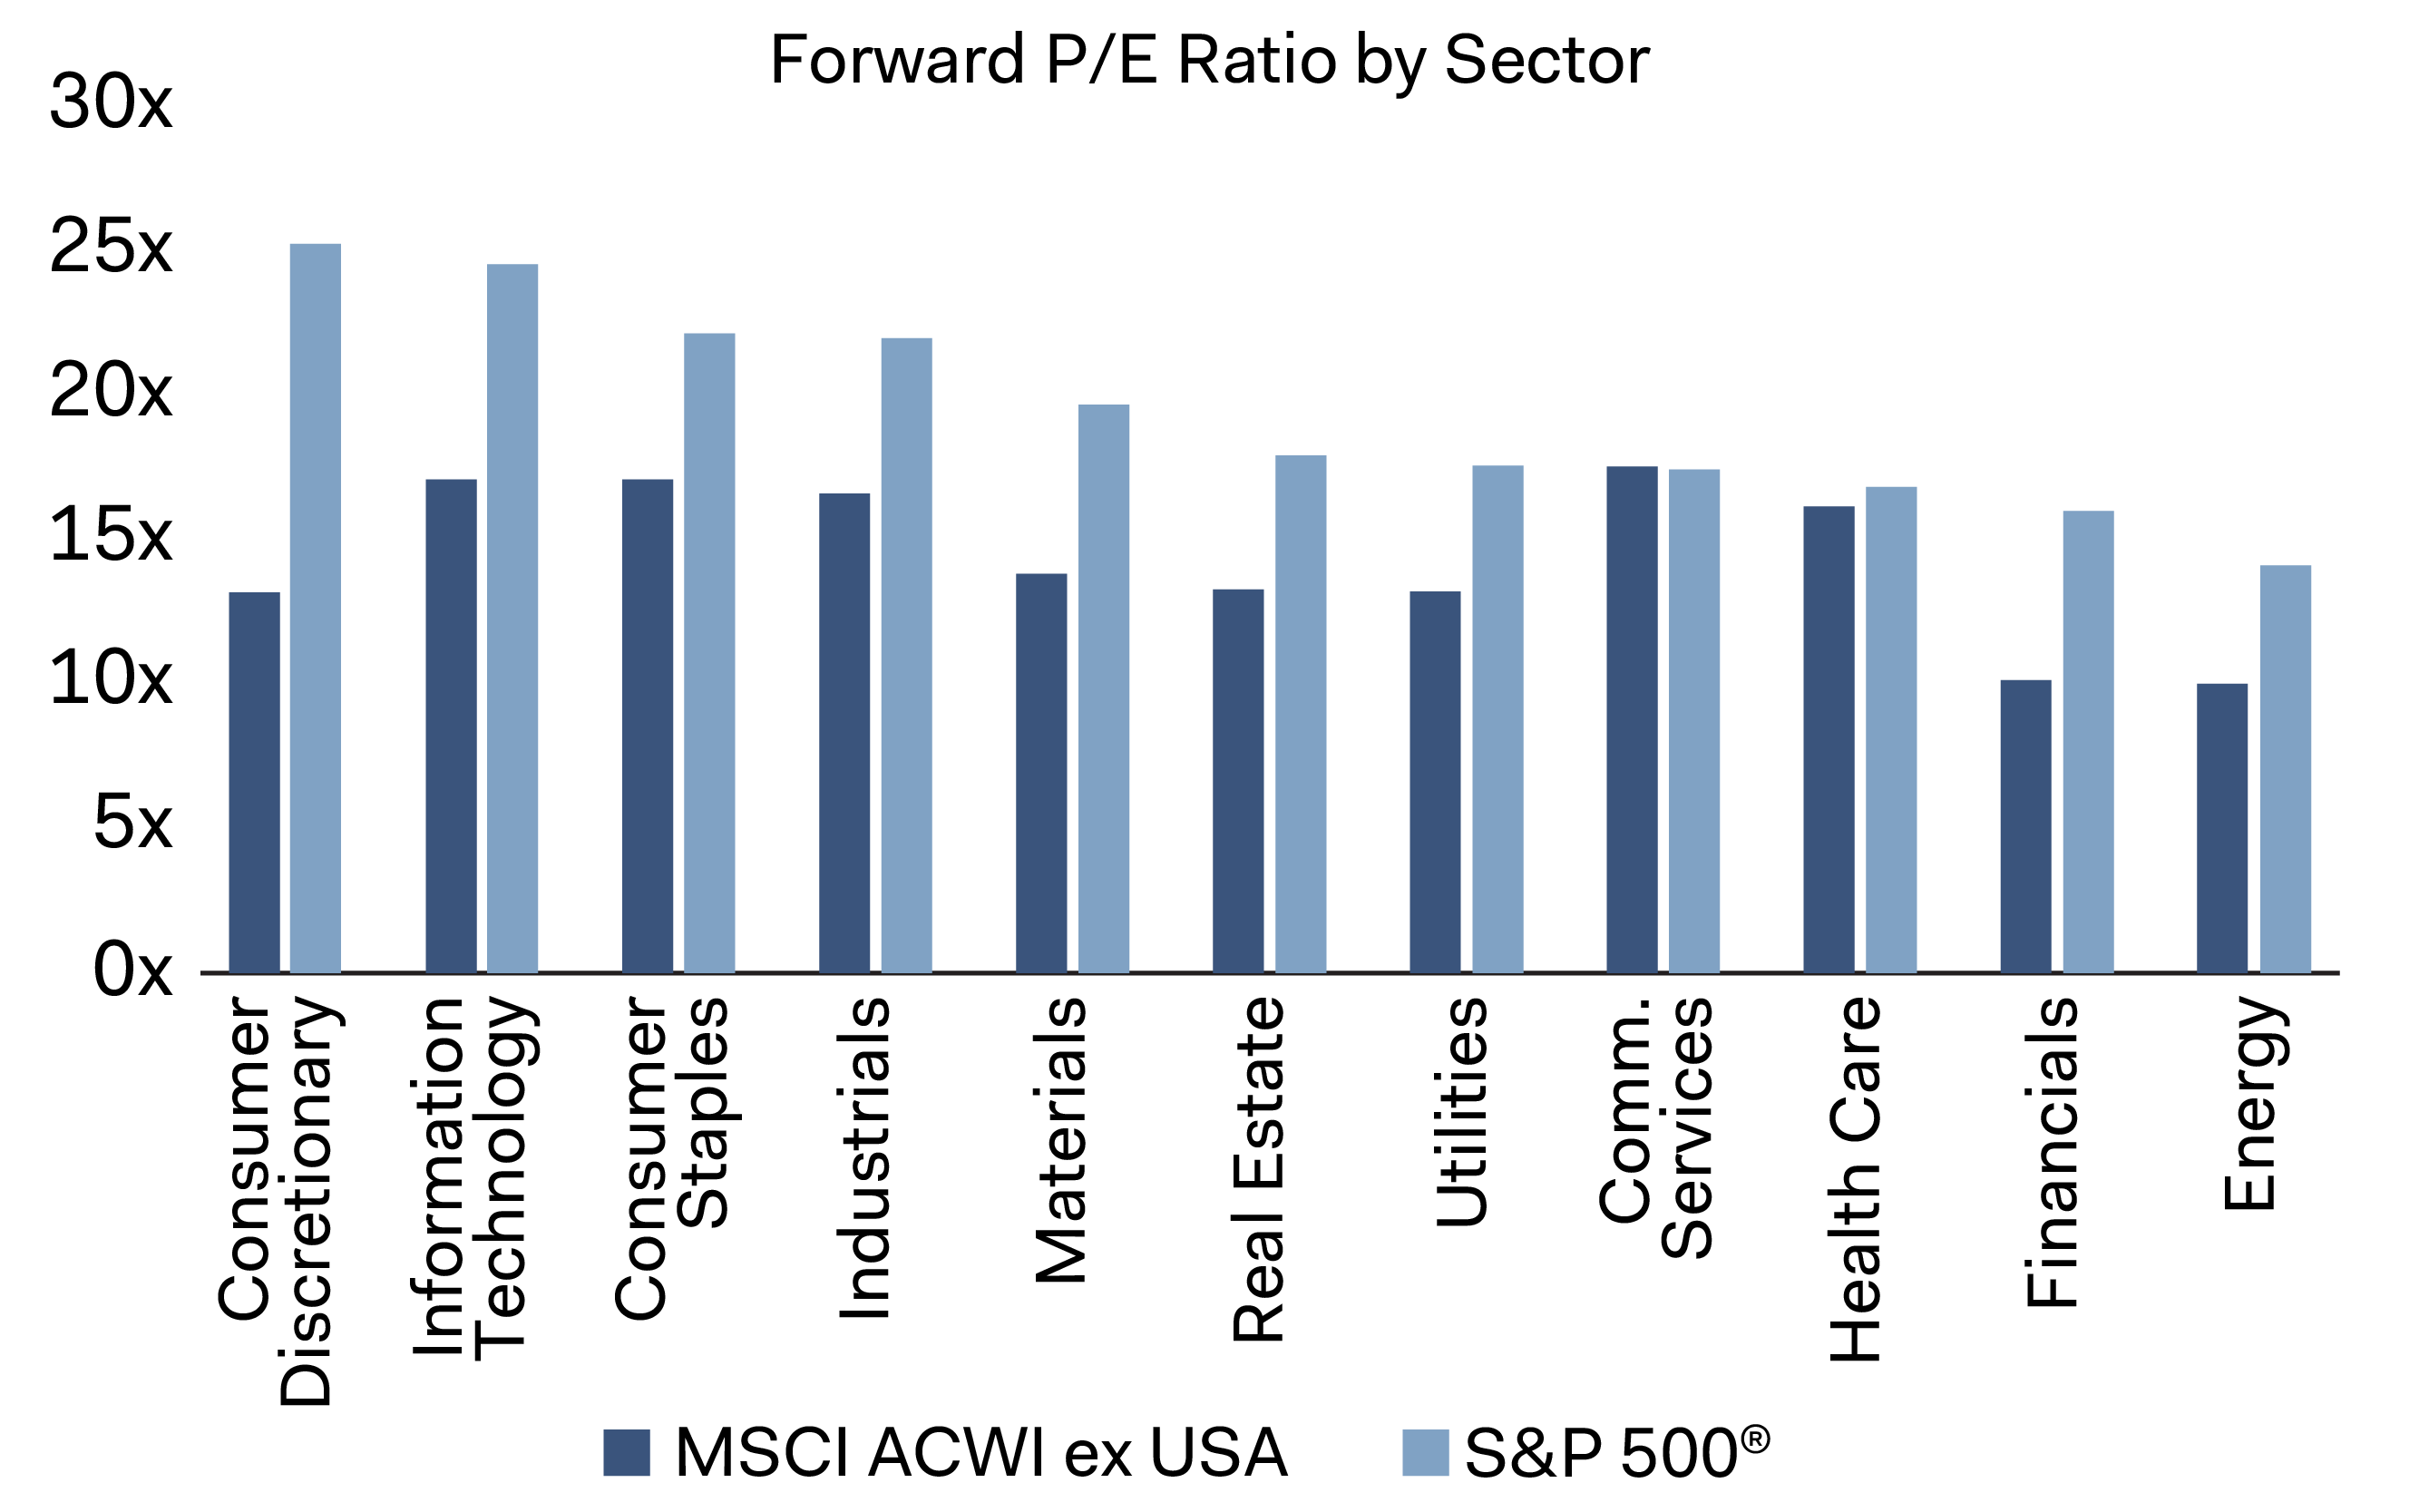
Source: FactSet, MSCI, S&P. Data is as of April 30, 2025.
Within international equities, the valuation spread between value and growth stocks remains wide. The MSCI ACWI ex USA Growth Index trades at 19.7 times forward earnings, almost double the MSCI ACWI ex USA Value Index at 10.5 times. We see these disparities as an opportunity to uncover attractive entry points across a range of industries.
Enhanced Diversification
The U.S. equity market is much more concentrated than the international equity market (see Figure 3). A handful of large technology and consumer-related companies dominate a sizable portion of the U.S. market. The combined size of the top five largest holdings in the S&P 500—Apple, Microsoft, NVIDIA, Amazon, and Alphabet—is greater than the market capitalization of any economy outside of the United States (see Figure 4). As of April 30, these five holdings accounted for 25.7% of the S&P 500’s total market capitalization.5 In contrast, the top five stocks in the MSCI ACWI ex USA comprised only 7.0% of that Index’s total market capitalization. International markets are typically more diversified with less dominance from any single sector or individual security.
Figure 3. The U.S. Equity Market Is Highly Concentrated5
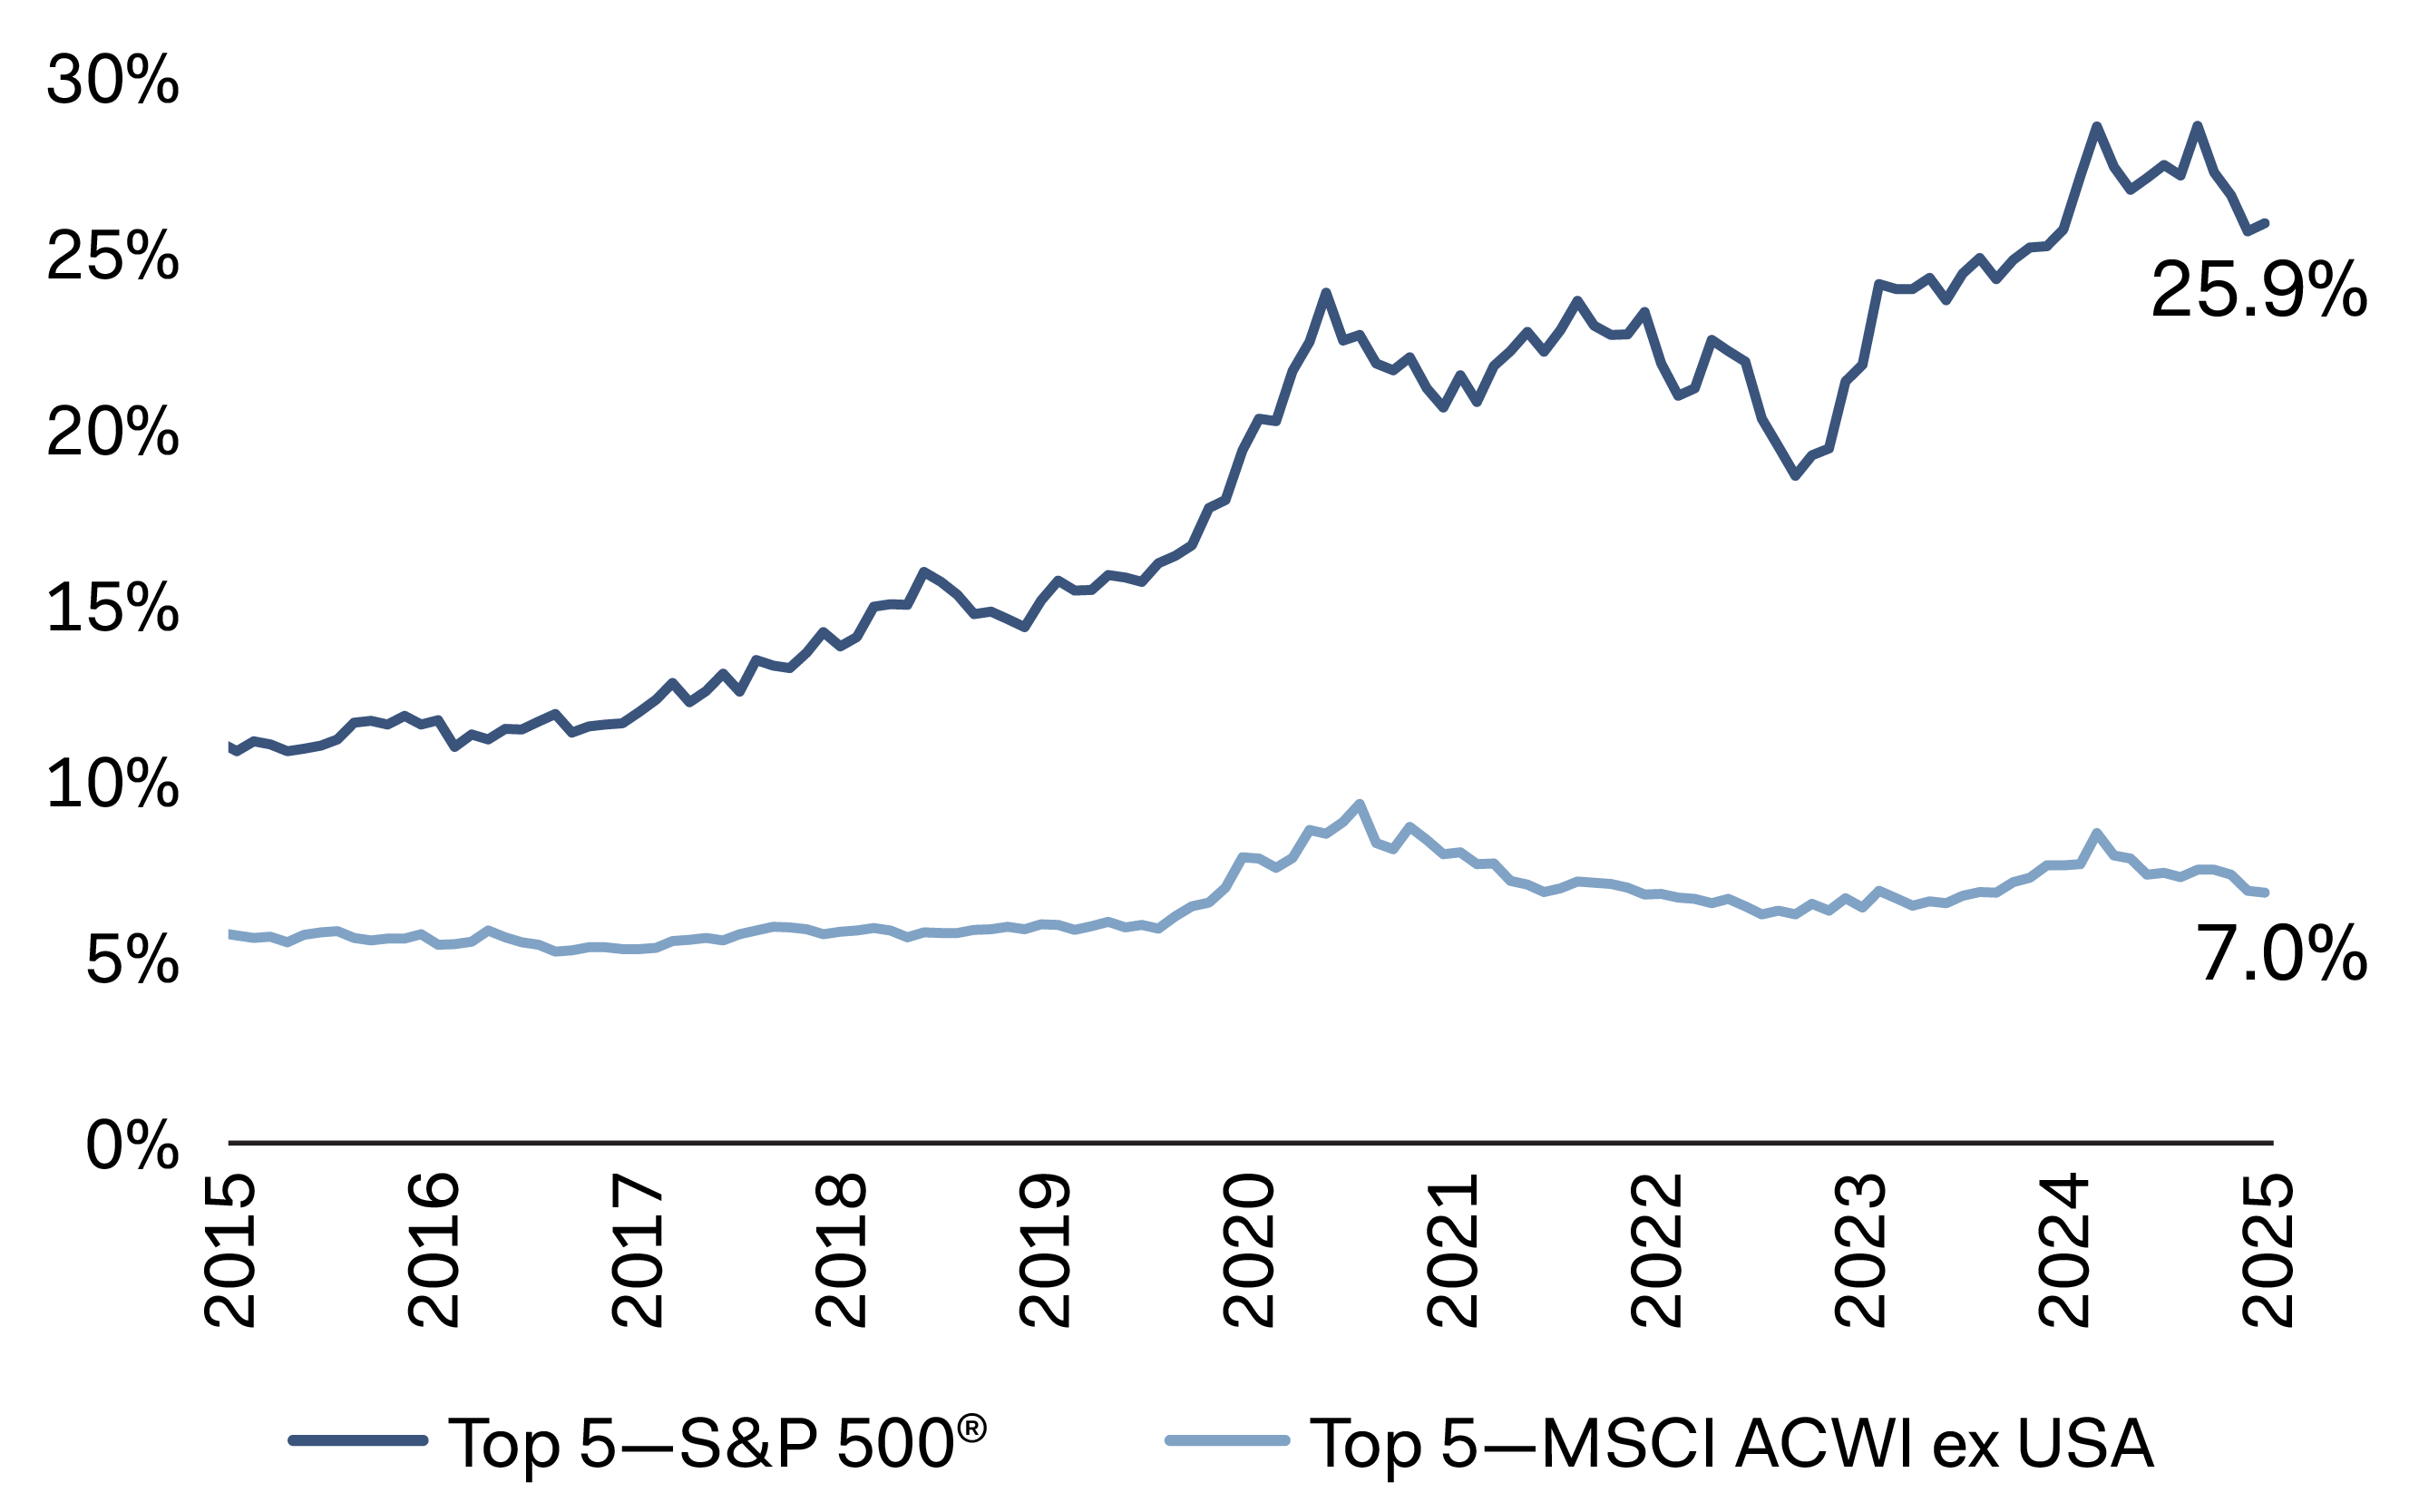
Source: FactSet, MSCI, S&P.
Figure 4. The Five Largest U.S. Stocks Are Bigger Than the Market Capitalization of Every Country Outside the U.S.6
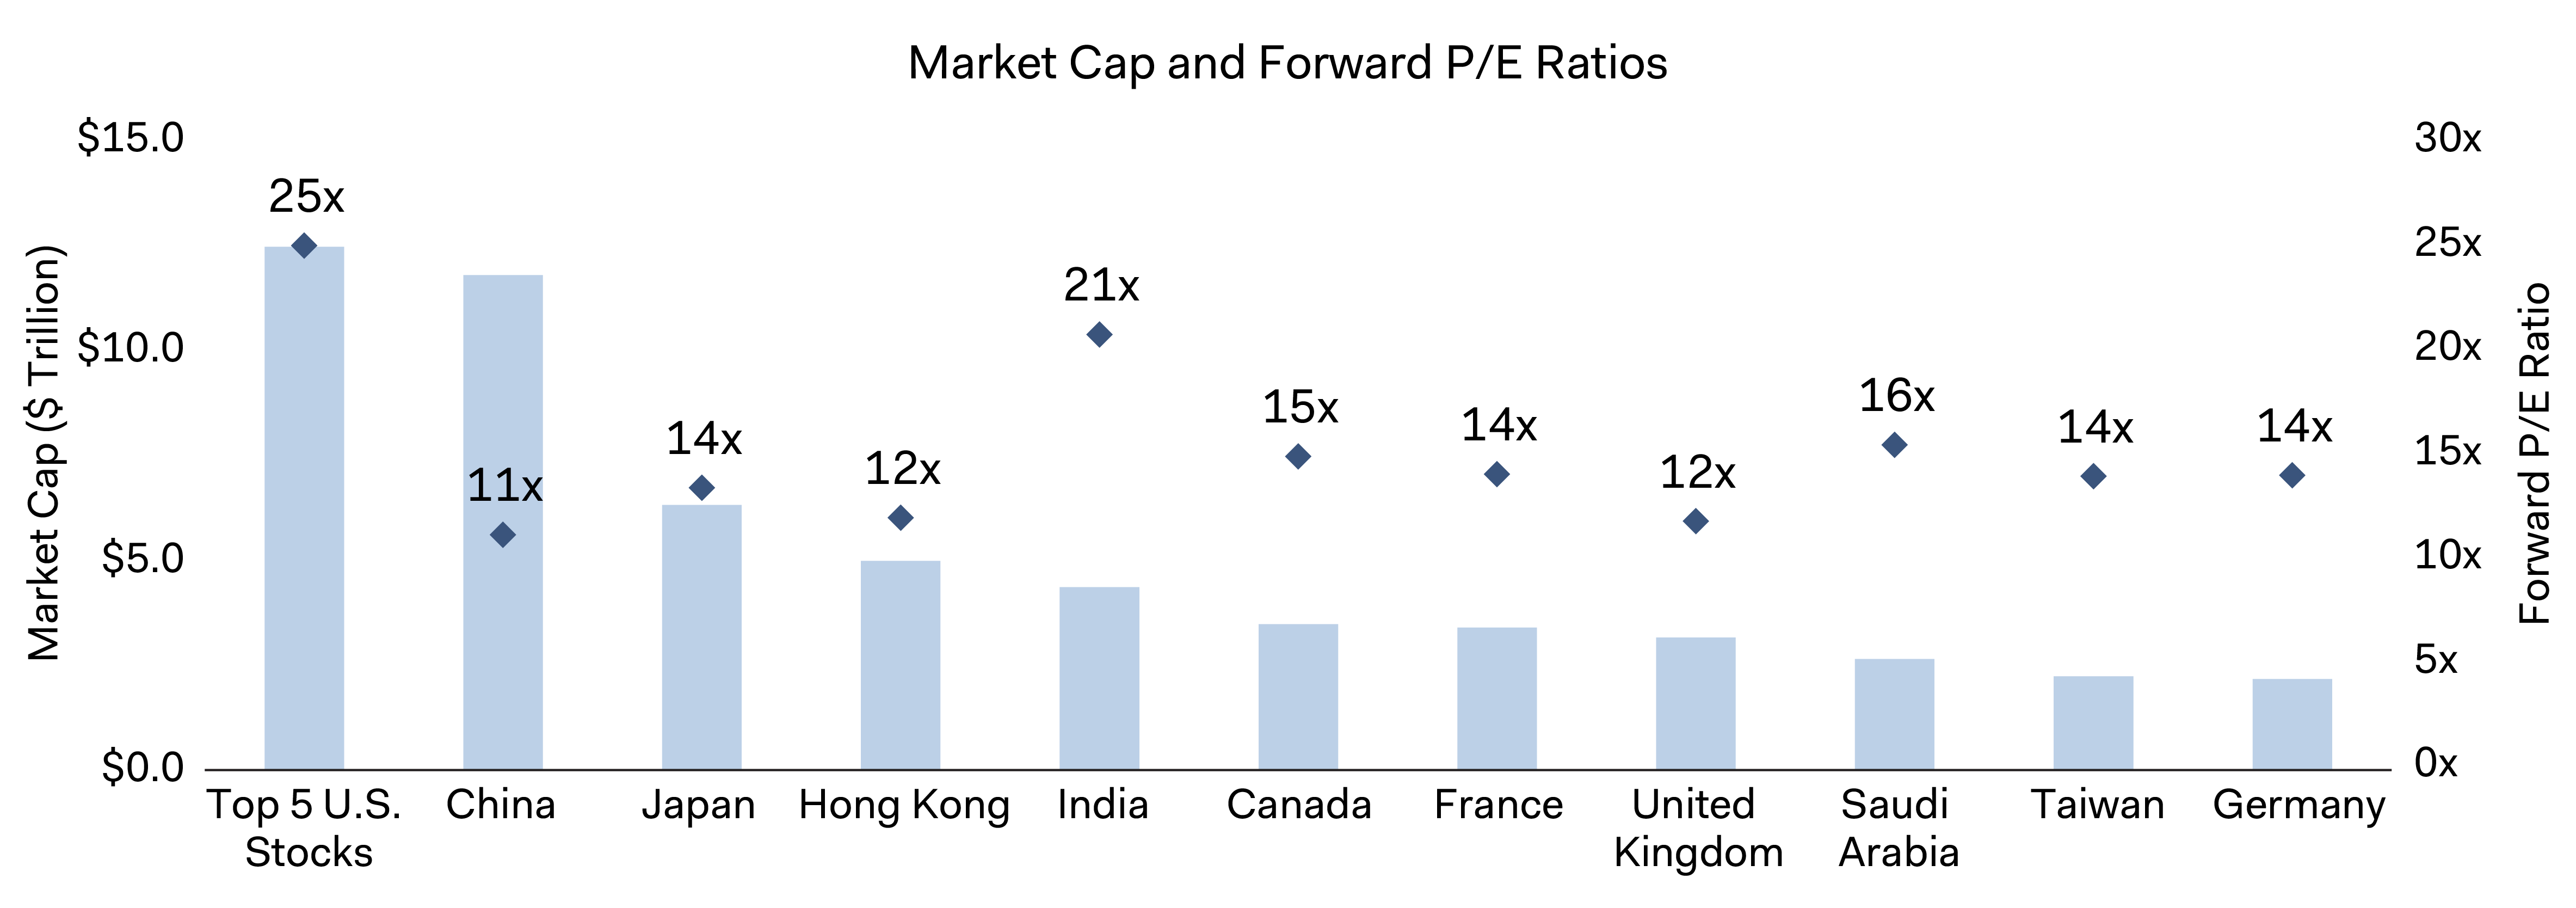
Source: CEIC, FactSet. Data is as of April 30, 2025.
Furthermore, international equities offer investors exposure to secular shifts in attractive markets. For example, technological innovation is no longer confined to Silicon Valley, as breakthroughs emerge from diverse hubs around the globe. In emerging markets, demographic trends—such as rapidly growing populations, a rising middle class, and increasing urbanization—are fueling consumption, innovation, and long-term economic growth.
Differentiated Opportunities for Active Managers
Diversifying portfolios alone does not ensure higher returns— being selective matters. There are many large international state-owned companies in the broader international indices that do not prioritize shareholder interests. Investing in those companies is not a recipe for long-term wealth creation.
Our in-depth research enables us to invest in differentiated international companies that we believe are well-positioned to generate strong long-term returns. While our thesis for each holding is unique, the following examples highlight businesses that are run by excellent management teams and trade at attractive valuations in our view.7 These companies have the potential to outperform their U.S. competitors, not have much U.S. competition, and/or operate in attractive end markets unavailable to U.S. peers.
- Coupang, often called the “Amazon of South Korea,” has experienced remarkable growth over the past five years, increasing its share of the Korean e-commerce market from 10% to 30%. Founder Bom Kim is credited with spearheading the innovation and operational excellence that have reshaped Korean e-commerce. The company offers a vast product assortment, low prices, and quick delivery—orders placed before midnight are delivered by 6 a.m. the next day. We believe Coupang is well positioned to maintain high growth and expand margins through high-margin advertising revenues and automation-led operational efficiency. Coupang trades at a reasonable valuation when excluding new vertical investments (e.g., restaurant delivery) or relative to gross merchandise value.
- Taiwan Semiconductor Manufacturing Co. (TSMC) dominates its global industry as the only semiconductor foundry capable of producing leading-edge computer chips used in artificial intelligence applications. Companies like NVIDIA and Apple rely on chips made by TSMC for their most advanced products, enabling the company to profit enormously from its unique competitive advantage. Despite the company’s stable client base, high market share, and product differentiation, TSMC trades at only 14.5 times forward earnings, a discount to its U.S. industry peers.
- Credicorp exemplifies a good company operating in an attractive market. It is the largest bank in Peru with ~30% market share. The local market is very attractive because the top five banks have over 80% market share. In our view, Credicorp is well-run and highly profitable. Its strong deposit franchise and leading scale drive lower funding and operating costs compared to peers. Led by the Romero family, who own ~15% of the company, Credicorp has prudently navigated credit cycles and generated lower loan losses (as a % of assets) versus peers. All these factors have contributed to Credicorp earning an average return on equity over the last 20 years of 18% versus 10% for U.S. banks.
Potential Boost to Competitiveness
While we construct portfolios on a bottom-up basis, we observe that international governments are embarking upon reforms to improve their competitiveness.
In Japan, corporate governance reforms to increase returns on equity appear to be gaining more traction. Over the past year, more companies have begun to unwind cross-shareholdings and conducted share buybacks to help boost their valuations.
Europe is becoming more business-friendly through deregulation and stimulus measures aimed at boosting economic growth and attracting investment. Additionally, the European Union is harmonizing regulations across member states, creating a more seamless environment for companies to expand and trade across borders. Some nations have introduced tax breaks and incentives to attract foreign investment. These efforts are making Europe a more attractive destination for businesses looking to expand their reach.
Conversely, the expectation that the United States will post stronger economic growth than other regions is more uncertain. Potential tariffs and frequent policy changes have caused market uncertainty and fears of higher inflation and a global recession. The outlook has shifted to a “jump ball” situation, with no clear winner in sight for global economic performance.
In Closing
Our stable and experienced investment team has navigated several market and economic cycles, which can be long. From 2001–2010, international equities outperformed U.S. equities by 56 percentage points, beating U.S. equities in seven of those 10 years.8 What's striking is that the starting valuation and U.S.-dollar strength back then is similar to today. In 2001, valuation disparities were wide, and the U.S. dollar had strengthened over the prior six years. While history won't repeat itself exactly, we believe the relative outlook for international equities is positive.
International investing is not without its risks. Political instability, currency fluctuations, regulatory changes, and geopolitical tensions all introduce uncertainty. However, skilled investors can mitigate these risks and generate excess returns through careful selection of individual stocks.
We welcome the opportunity to discuss our active, value-oriented approach to international investing and believe now is an opportune time to seize opportunities that lie beyond U.S. borders.
Contributors


Disclosures
The above information is not a complete analysis of every material fact concerning any market, industry, or investment. Data has been obtained from sources considered reliable, but Dodge & Cox makes no representations as to the completeness or accuracy of such information. Opinions expressed are subject to change without notice. The above returns represent past performance and do not guarantee future results. Dodge & Cox does not seek to replicate the returns of any index. The actual returns of a Dodge & Cox managed portfolio may differ materially from the returns shown above. The information provided is historical and does not predict future results or profitability. This is not a recommendation to buy, sell, or hold any security and is not indicative of Dodge & Cox’s current or future trading activity. Diversification does not ensure a profit or guarantee against losses. All Dodge & Cox trademarks are owned by Dodge & Cox and its affiliates. All other company and product names mentioned are the trademarks or registered trademarks of their respective companies. This information should not be considered a solicitation or an offer to purchase or sell any securities in any jurisdiction or a solicitation or an offer to provide any services in any jurisdiction.
The MSCI information may only be used for your internal use, may not be reproduced or redisseminated in any form and may not be used as a basis for or a component of any financial instruments or products or indices. None of the MSCI information is intended to constitute investment advice or a recommendation to make (or refrain from making) any kind of investment decision and may not be relied on as such. Historical data and analysis should not be taken as an indication or guarantee of any future performance analysis, forecast or prediction. The MSCI Information is provided on an “as is” basis and the user of this information assumes the entire risk of any use made of this information. MSCI, each of its affiliates and each other person involved in or related to compiling, computing or creating any MSCI information (collectively, the “MSCI Parties”) expressly disclaims all warranties (including, without limitation, any warranties of originality, accuracy, completeness, timeliness, non-infringement, merchantability and fitness for a particular purpose) with respect to this information. Without limiting any of the foregoing, in no event shall any MSCI Party have any liability for any direct, indirect, special, incidental, punitive, consequential (including, without limitation, lost profits) or any other damages. MSCI®, EAFE®, and ACWI® are trademarks of MSCI, Inc. (www.msci.com)
The S&P 500 Index (“Index”) and associated data are a product of S&P Dow Jones Indices LLC, its affiliates and/or their licensors and has been licensed for use by Dodge & Cox. © 2024 S&P Dow Jones Indices LLC, its affiliates and/or their licensors. All rights reserved. Redistribution or reproduction in whole or in part are prohibited without written permission of S&P Dow Jones Indices LLC. For more information on any of S&P Dow Jones Indices LLC’s indices please visit www.spdji.com. S&P® is a registered trademark of Standard & Poor’s Financial Services LLC (“SPFS”) and Dow Jones® is a registered trademark of Dow Jones Trademark Holdings LLC (“Dow Jones”). Neither S&P Dow Jones Indices LLC, SPFS, Dow Jones, their affiliates nor their licensors (“S&P DJI”) make any representation or warranty, express or implied, as to the ability of any index to accurately represent the asset class or market sector that it purports to represent and S&P DJI shall have no liability for any errors, omissions, or interruptions of any index or the data included therein.
See Disclosures for a full list of financial terms and Index definitions.
Endnotes
1. From December 31, 2009 to December 31, 2024, the S&P 500 Index had a total return on 601.35% compared to 98.53% for the MSCI ACWI ex USA Index.
2. From December 31, 2024 to April 30, 2025, the MSCI ACWI ex USA Index had a total return on 9.03% compared to -4.92% for the S&P 500 Index.
3. Relative historical valuations shown are using forward price-to-earnings valuations from June 30, 2003 to December 31, 2024 and April 30, 2025.
4. Unless otherwise specified, all weightings and characteristics are as of April 30, 2025.
5. “Top 5” refers to the top 5 company weights for each respective index compiled on a monthly basis over the period shown.
6. “Top 5 U.S. Stocks” includes the top 5 companies with the largest weight in the S&P 500 as of the most recent quarter end period and represents a summation of their individual market caps. Forward price-to-earnings ratio value for the “Top 5 U.S. Stocks” is a market capitalization weighted average of the individual companies and is sourced from FactSet. Market capitalization values for the subsequently listed countries are sourced from the latest available market cap data on CEIC. Forward P/E values for the countries listed are sourced from FactSet.
7. The use of specific examples does not imply that they are more or less attractive investments than other securities in the investment universe.
8. From December 31, 2000 to December 31, 2010, the MSCI ACWI ex USA Index had a total return on 71.53% compared to 15.07% for the S&P 500 Index.