You'll be re-directed to the Institutional Investor site.
Key Takeaways
- Aggregate single-employer plan funded status rose to 105.2% in the first quarter as a sharp increase in U.S. Treasury yields across the curve outweighed the equity market drawdown.
- This quarter’s capital markets volatility provided many plan sponsors with opportunities to rebalance, de-risk, and stake out tactical positions. With market volatility poised to continue, we encourage plan sponsors to remain nimble.
- While our base case macro outlook calls for above-trend growth in 2022, the embedded geopolitical, Federal Reserve policy, and inflation risks could lead to more spread dispersion across fixed income sectors and issuers. This could create opportunities to add value via issuer selection, in addition to being tactical with overall credit exposure and by remaining short duration.
- In the current environment of improving funded status, rising interest rates, and more lenient funding requirements, we anticipate lower contributions, robust pension risk transfers, and lower lump sum activity.
Quarterly Funded Status Drivers
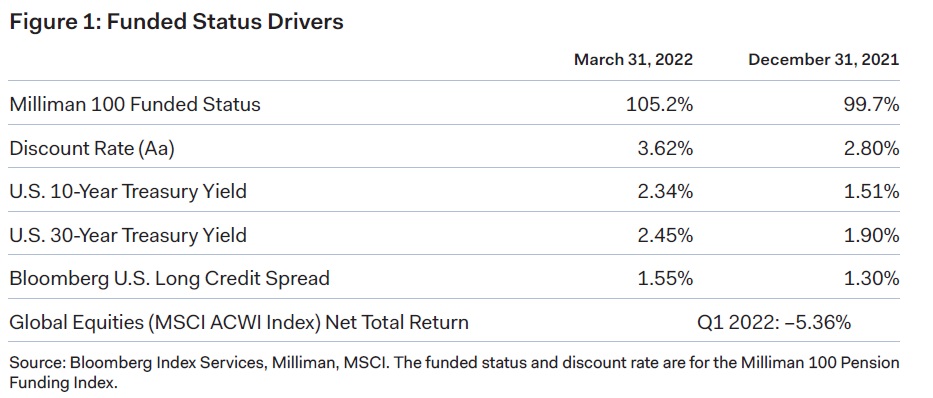
Despite tumultuous global events, a hawkish pivot by the Fed, and negative returns in broad fixed income and equity markets, overall funded status remained strong and in many cases rose as the decline in liabilities outpaced the decline in assets. According to Milliman, the aggregate funded status of the 100 largest pension plans ended the quarter at 105.2%, representing an increase of 5.5%. Rising Treasury yields were a boon to plan sponsors, many of whom were underhedged with respect to interest rate risk, and, depending on the magnitude of the underweight, offset some or all of the negative impact from falling equity markets. The impact from widening credit spreads varied, depending on the magnitude and nature of the credit exposure relative to the discount rate.
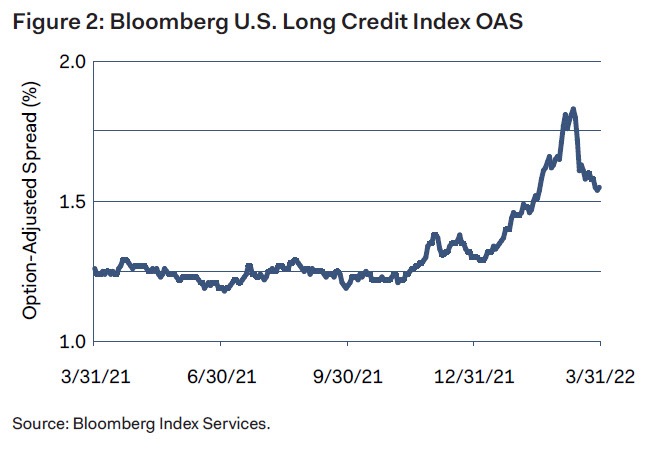
Treasury yields rose across the curve, with 2-, 10-, and 30-year yields rising 160, 83, and 55 basis points2 respectively, and the curve being essentially flat beyond the 2-year point. As measured by the Bloomberg U.S. Long Credit Index, long credit spreads widened 25 basis points quarter-over quarter, though that point-to-point increase masked somewhat heightened intra-period volatility, that is, a steady increase to a peak of 183 basis points by March 14 followed by rapid tightening in the last two weeks of the quarter (see Figure 2). Similarly, global equity markets reached their lows in mid-March, with the MSCI All Country World Index (Net) returning –13% through March 8, but turned around sharply after that; emerging markets underperformed developed markets.
The Macro View
Our base case macro outlook remains somewhat optimistic, though less so than at the beginning of the year. On the positive side, we expect the economy to grow above trend for the rest of the year, supported by strong corporate and consumer balance sheets. Inflation is likely to remain high, but moderate next year, thanks to a more hawkish Fed and potential easing of supply bottlenecks and energy prices. However, against this positive backdrop, we see a number of risks including the potential for more entrenched supply chain disruptions, further labor market tightness, a Fed policy error, and geopolitical risks. This broad range of outcomes and the associated range of views among market participants may portend extended market volatility. Plan sponsors may wish to remain disciplined in their investment strategy and ensure that they have efficient processes in place to rebalance, de-risk, and, if desired, stake out tactical positions.
Being Nimble Within Liability-Hedging Assets
The first quarter provided several opportunities to rebalance within liability-hedging assets (LHA). To take one example, widening credit spreads and underperformance of credit relative to Treasuries through mid-March (with the Bloomberg U.S. Long Credit Index posting a quarter-to-date excess return of –6.0% through March 8) may have resulted in sufficiently large deviations from targets to necessitate rebalancing from Treasuries into credit. In addition, with Long Credit underperforming Intermediate Credit by a factor of 2.2 for the quarter (with the respective Bloomberg indices posting returns of –11.2% versus –5.1%), plan sponsors with exposures to both strategies may consider rebalancing as well.
From a tactical perspective, for plan sponsors who were underweight credit for much of 2021 on account of historically low credit spreads, the steady credit spread widening in January and February may have allowed them to gradually move back into credit. As credit spreads rose above their 10- and 20-year averages in mid-March, a modest tactical overweight to credit may have been justified as well. With spreads materially tighter since mid-March, that decision has likely paid off. We anticipate more opportunities to be nimble with credit throughout 2022.
At the portfolio level, we increased the credit exposure across our liability hedging strategies, although to varying degrees, reflecting different opportunity sets and benchmark considerations. While valuations are certainly more attractive now than at the beginning of the quarter, we are preserving some dry powder in the form of Treasuries and Agency3 mortgage-backed-securities as prospects for market volatility remain elevated. Where permitted, Treasury futures help facilitate our flexibility with respect to individual credit selection (by allowing us to manage duration in a capital-efficient way, rather than relying on corporates to provide both duration and spread exposure). We are also prepared (where permitted) to use exchange-traded funds (ETFs) to take advantage of rapid market dislocations, should spreads widen above historical averages or to other attractive levels.
Interest Rate Triggers
Another way to be nimble within liability-hedging assets in the current environment is by managing the interest rate hedge ratio and duration. Tactical underweights in expectation of rising interest rates paid off last quarter, as both 10- and 30-year Treasury yields rose over 50 basis points in just three months and reached levels not seen in three years. In particular, the 10-year yield rose 51 basis points in March; a monthly move of this magnitude or greater has occurred only 6% of the time in the last twenty years.
For plan sponsors with more systematic approaches, such as glide paths or hedge paths with interest-rate-based triggers, rising rates likely translated into meaningful de-risking steps. Incorporating either a tactical or systematic approach to take advantage of rising interest rates may be worthwhile. Our baseline yield curve scenario calls for further increases of roughly 40 to 50 basis points on the long end of the curve over the next two years, which is somewhat higher than the forward curve implies. Consequently, in our full-discretion portfolios, we are continuing to maintain a modest duration underweight.
Credit Dispersion and Issuance
The quarter left no major segment of the credit universe unscathed, as all major sectors posted wider spreads and negative excess returns. However, the rout was not uniform, as energy significantly outperformed other corporate sectors on an excess return basis, as did the government-related sector of the investment-grade (IG) credit space, including, in particular, sovereigns. Going forward, we expect sector and issuer dispersion to increase further as different drivers of inflation, rising interest rates, and M&A activity may affect issuers differently.
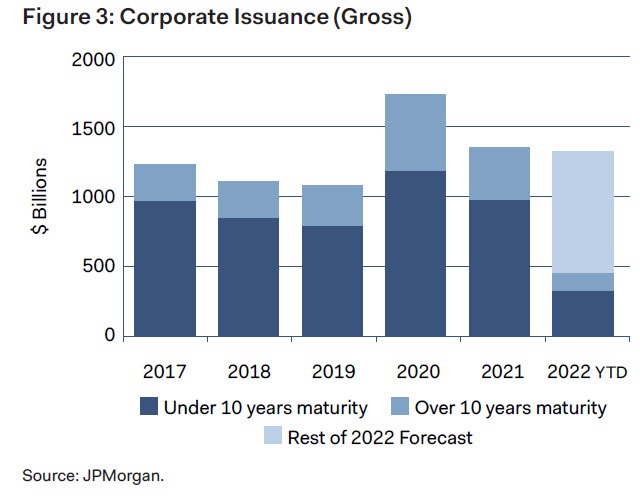
First quarter gross IG corporate issuance has been strong (see Figure 3), exceeding the first quarter of 2021 by almost 10%. March was the fourth-largest month for corporate issuance on record (with the other three occurring in the immediate aftermath of the COVID-related spike in March 2020). While overseas demand for U.S. corporate bonds may be declining due to rising interest rates globally and higher currency hedging costs, future supply is likely to be met, in part, by continuing de-risking demand from corporate pension plans. We capitalized on recent issuance, taking part in several new issues last quarter as new issue concessions have been particularly attractive.
Strategic Considerations
In the current environment of improving funded status, rising interest rates, and more lenient funding requirements (thanks to the American Rescue Plan Act enacted in 2021), we anticipate lower contributions, robust pension risk transfers (PRT), and lower lump sum activity.
According to LIMRA, PRT activity, including both buy-outs and buy-ins, totaled $38 billion in 2021, the highest since 2012. The 2022 PRT market is likely to remain very active thanks to more plan sponsors being in a position to execute a PRT, continuing insurer interest in the business, and competitive PRT pricing. For example, rising interest rates are likely to reduce the dollar amount of the PRT premium relative to the balance sheet liability (even if the PRT premium as a percentage of balance sheet liability remains relatively stable) making PRT even more attractive from a corporate balance sheet perspective. However, long-term growth in PRT may be tempered by limited insurer capacity, increasing regulatory scrutiny (for example, by the National Association of Insurance Commissioners), and by significantly overfunded plan sponsors being in a stronger position to be more flexible about the timing and structure of their PRTs.
As for lump sums, since they are typically determined using lagged interest rates, offering lump sums in 2022 is likely to be more costly than maintaining the associated balance sheet liability, leading many plan sponsors to delay lump sum windows until interest rates stabilize or begin declining. However, for plan sponsors seeking to fully terminate their plans in 2022, offering lump sums may still be worthwhile.
As always, we would welcome the opportunity to speak with you about your pension risk management objectives as you proceed on your pension journey.
Contributors


Disclosures
The above information is not a complete analysis of every material fact concerning any market, industry, or investment. Data has been obtained from sources considered reliable, but Dodge & Cox makes no representations as to the completeness or accuracy of such information. Opinions expressed are subject to change without notice. Information regarding yield, quality, maturity, and/ or duration does not pertain to accounts managed by Dodge & Cox. The above returns represent past performance and do not guarantee future results. Dodge & Cox does not seek to replicate the returns of any index. The actual returns of a Dodge & Cox managed portfolio may differ materially from the returns shown above. This is not a recommendation to buy, sell, or hold any security and is not indicative of Dodge & Cox’s current or future trading activity. The securities identified are subject to change without notice and may not represent an account’s entire holdings.
Source: Bloomberg Index Services Limited. BLOOMBERG® is a trademark and service mark of Bloomberg Finance, L.P. and its affiliates (collectively “Bloomberg”). Bloomberg or Bloomberg’s licensors own all proprietary rights in the Bloomberg Indices. Bloomberg does not approve or endorse this material, guarantee the accuracy or completeness of any information herein, or make any warranty, express or implied, as to the results to be obtained therefrom and, to the maximum extent allowed by law, shall have no liability or responsibility for injury or damages arising in connection therewith. The Bloomberg U.S. Long Credit Index measures the performance of investment grade, U.S. dollar-denominated, fixed-rate, taxable corporate and government-related debt with at least ten years to maturity. It is composed of a corporate and a non-corporate component that includes non-U.S. agencies, sovereigns, supranationals and local authorities.
The MSCI ACWI (All Country World Index) Index is a broad-based, unmanaged equity market index aggregated from 47 developed and emerging market country indices. MSCI makes no express or implied warranties or representations and shall have no liability whatsoever with respect to any MSCI data contained herein. The MSCI data may not be further redistributed or used as a basis for other indices or any securities or financial products. This publication is not approved, reviewed, or produced by MSCI.
Foonotes
(1) The information in this paper should not be considered fiduciary investment advice under the Employee Retirement Income Security Act. This paper provides general information not individualized to the particular needs of any plan and should not be relied on as a primary basis for investment decisions. The fiduciaries of a plan should consult with their advisers as needed before making investment decisions.
(b) One basis point is equal to 1/100th of 1%.
(c) The U.S. Government does not guarantee the yield or net asset value. The agency guarantee (by, for example, Ginnie Mae, Fannie Mae, or Freddie Mac) does not eliminate market risk.