You'll be re-directed to the Financial Professional site.
EXECUTIVE SUMMARY
While many active equity managers do not out- perform the market in any given year, there are a number of skilled active investment managers who have outperformed over long investment horizons. However, in order to benefit from this kind of long-term outperformance, investors must be prepared to take a long-term view and have the discipline to withstand inevitable periods of underperformance. Those who stay the course are more likely to achieve meaningful incremental results that accumulate over time.
Academic and industry research has identified six attributes of active managers who have the highest probability of generating above-benchmark long- term results. This research has also confirmed that investors are well advised to take a long-term view, not only because few investors can accurately time the stock market, but also because few can effectively time their decisions to hire and fire investment managers.
THE ACTIVE VERSUS PASSIVE DEBATE
One of the fiercest ongoing debates in investing concerns the merits of active versus passive approaches to investing. There has been substantial focus on the fact that a high percentage of active managers have underperformed their passively managed peers in recent years. But the case against active investing is not as clear cut as its critics suggest. There are, in fact, substantial opportunities for astute managers who take an active approach to outper- form passive alternatives. While no active manager can beat all markets all the time, a significant number of active managers have outperformed over longer-term intervals.
The most frequently cited evidence against active management is that the majority of active managers fail to beat their benchmark each year. But that turns out to be flawed approach to measuring long-term investment performance. Evaluating and comparing results for a calendar year may be convenient but not necessarily meaningful. In fact, 12 months, and particularly the 12 months that start each January, is an interval that gener- ally doesn’t encompass a complete market cycle, nor does it capture the success or failure of active management strategies, which tend to have longer investment horizons.
A value manager who adds a stock in January may still be waiting for the value he or she saw to be reflected in the market in December. Was the manager right or wrong? It’s too soon to tell. Similarly, a growth stock manager may buy a stock in April, anticipating that the company is about to move onto a higher growth trajectory. The manager’s thesis may be right or wrong, but it won’t necessarily be proven by the end of that year.
The Long-Term Perspective
Let’s now shift the focus of the active versus passive debate to longer-term performance. According to Morn- ingstar, 107 U.S. large-cap active equity funds have outperformed their benchmark over the past 20 years, out of a universe of 305 funds that have 20-year performance data.(a) These figures are flattered by the fact this universe only includes the funds that have survived 20 years.
The median outperformance by the 107 funds was 0.6 percentage points per year, with a high of 4.2 percentage points. Clearly outperformance is a game of inches, but because of the power of compounding, even modest out- performance can lead to substantial incremental returns over the long run.
It is telling that among those funds that have outper- formed over the most recent 20-year period, when their respective results are divided into five calendar-year per- formance periods, the average fund outperformed in only
10 of the 16 five-year periods during the last 20 years. In short, over the long term certain active managers can add significant value, but that process involves an uneven road in which there will be years of sub-par performance as well as years of very good performance. Nonetheless, about a third of active managers described above beat the benchmark over the long term.
Passive investing advocates may protest: Who invests for 20 years? Answer: Many individuals, foundations, pensions, and other investors have investment horizons stretching 20 years and beyond. Foundations and en- dowments generally aspire to exist in perpetuity, so their investment horizon should be very long. Pension funds also typically have a long-term horizon; defined benefit plans may be taking in contributions for employees in their 20s to fund benefits that will not begin to be paid for as long as 40 years in the future, and then may last for an- other 30 years. As for individual investors, many people, whether making personal investments or participating in a defined contribution retirement plan, have long-term investment goals. Because of increasing longevity, even investors in their 70s can often expect to live another 20 years. Of course, not all investors invest for the long term; those with short-term financial needs should consider their investment horizon in selecting the strategies and asset classes that best meet their needs.
Issues like immediate financial needs or simply a lack of patience may lead investors to take a shorter-term view—and that may also lead their managers to adopt a shorter-term view in order to please their clients. But taking the long view is critical when investing in equities; similarly, measuring active managers over the long term is the best way to discover which ones truly have stock-picking skill.
CHOOSING THE RIGHT ACTIVE MANAGER
Assuming there are opportunities to benefit from active management, the next question is how to choose the right manager. What are the attributes of active managers who have the greatest potential to outperform? There is a body of research seeking to delineate the characteristics of successful active managers, and this research has identified six key features: Four are associated with the characteristics of the portfolio, and two are related to the nature of the investment manager. Each is linked in a statistically significant way to long-term outperformance, identifiable in advance, persistent, and under the control of the investment manager.
High “Active Share”
An active manager can only add value relative to the index by deviating from it, but there can be vast differ- ences in the extent to which a manager is “active.” In fact, active and passive are not polar opposites but rather ends of a spectrum or continuum, and managers may be situated at various points on that spectrum. Close to the passive end, there are enhanced indexing strategies and smart beta strategies. These begin with an index tracking approach, but the managers apply judgments regarding when and how to deviate from the index. In addition to these explicit efforts to move along the spectrum from passive to slightly active, there is also the phenomenon of “closet indexing.” In this approach, ostensibly active managers consciously but quietly choose to track the index in many ways and make only a limited number of departures from it. This enables them to come close to tracking the results of the index, but hopefully outperform it by a little.
In contrast to these quasi-active (or are they quasi-pas- sive?) investors, there are those who are truly active managers—those whose investment decisions move their portfolios far afield from the benchmark. One way to measure how active an active manager is entails measuring a portfolio’s “active share.” This determines the proportion of a portfolio that is different from its benchmark. Active share can range from 0% (which im- plies a portfolio and its benchmark are the same) to 100%, which denotes no overlap between the portfolio and an index. Roughly 30% of U.S. large-cap active equity funds (representing about 20% of assets under management for the U.S. large-cap fund universe described above) have an active share above 80%.(b)
Numerous studies show managers with high active share strategies are more likely to generate long-term alpha. Martijn Cremers and Antti Petajisto wrote the seminal study defining active share: How Active Is Your Fund Manager? A New Measure That Predicts Performance.(c) They concluded, “Funds with the highest Active Share significantly outperform their benchmarks, both before and after expenses, and they exhibit strong performance persistence. Non-index funds with the lowest Active Share underperform their benchmarks.” Concentrated stock pickers (high active share, high tracking error(d)) tend to perform the best, followed by diversified stock pickers (high active share, low tracking error). Even after fees and transaction costs, both of these groups beat their benchmarks. The study also found that active share was persistent, meaning that a manager in a particular active share decile was likely to stay in that decile over time.
In Active Share and Mutual Fund Performance,(e) Antti Petajisto updated his earlier study with Cremers through 2013 and again confirmed that the most active stock pickers were more likely to outperform their benchmarks, even after fees. His study showed active mutual funds with high active share/lower tracking error—the “Diver- sified Stock Picks” in the previous study—outperformed their benchmark by an average of 1.26 percentage points per year after fees and expenses. Managers with more investment conviction beat “closet indexers” (those with an active share below 60%), who consistently un- derperformed. These patterns held true both during the 2008-2009 financial crisis and within market-cap styles.
By definition, funds with a high active share have greater potential to generate returns that are significantly different from the index. That difference could be positive or negative, but research indicates that a number of managers have, in fact, generated outperformance by their active management.
Different Types of Active Management
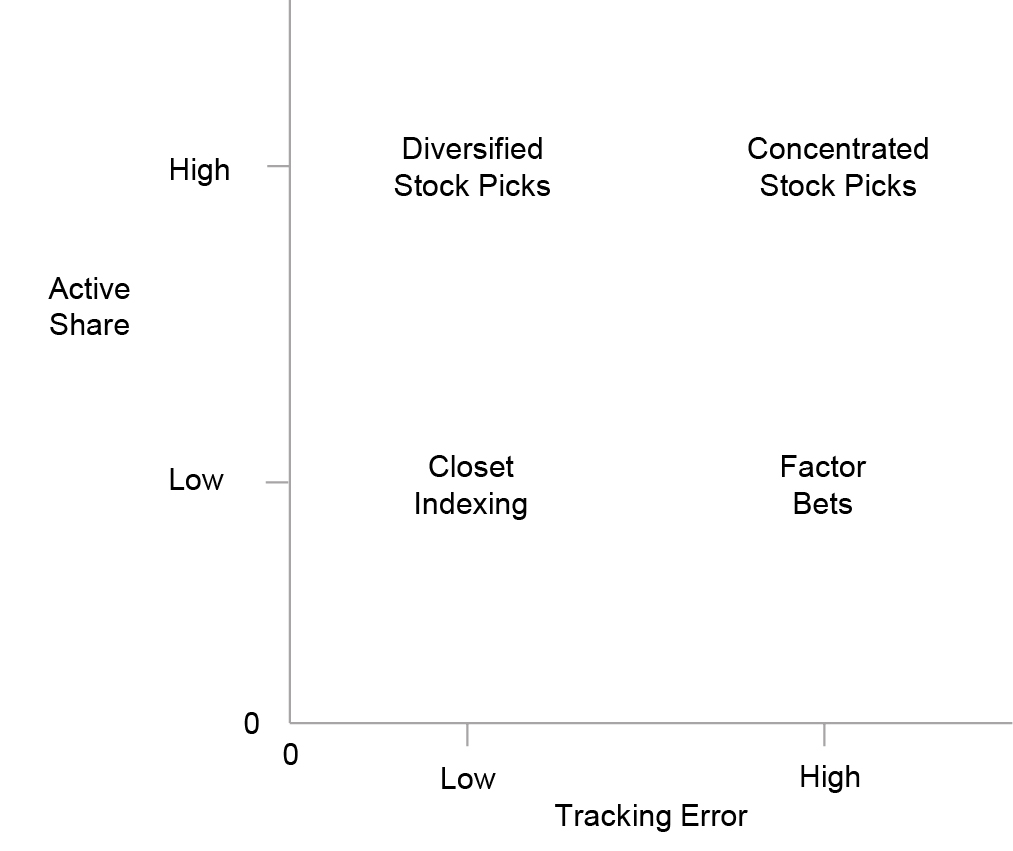
Source: Cremers and Petajisto (2009)
Low Fees and Expenses
A second attribute that affects an active manager’s ability to beat its benchmarks is the level of fees and expenses as- sociated with its portfolio. As has been noted, even if out- performance is persistent, it may be by only a percentage point or two, so gross outperformance can be significantly reduced if there are sizable fees and expenses associated with the management of a portfolio. The performance benchmark is not affected by fees and expenses—it’s simply a calculation based on prices. Index funds require less portfolio management expertise because they track the index as closely as possible, and therefore seek to keep their fees and expenses low. But an active manager has to generate gross returns that are sufficiently higher than the benchmark so that when the manager’s fees and expenses are deducted, the manager will still outperform the benchmark on a net basis. In fact, numerous studies have identified cohorts of active managers who generate above average returns gross of fees and expenses,(f) but most underperform net of fees and expenses.
In one such study, On Persistence in Mutual Fund Performance,(g) Mark Carhart concluded, “Although the top-decile mutual funds earn back their investment costs, most funds underperform by about the magnitude of their investment expenses.” In order to outperform, it’s not enough to beat the benchmark; the manager must beat it by enough so that after fees and expenses, the net perfor- mance is better than the benchmark. Those with lower fees and expenses have a better chance of outperforming.
Fees and expenses matter greatly. Antti Petajisto(h) ob- served, “For each dollar in expenses, the fund’s net return actually suffers by slightly more than a dollar.” Carhart noted load funds consistently underperform no-load funds: “After controlling for the correlation between expenses and loads, and removing the worst-performing quintile of funds, the average load fund underperforms the average no-load fund by approximately 80 basis points per year.” Much of the underperformance can be attributed to the relatively high fees associated with load funds.
Similarly, Morningstar analyzed the top 20 mutual fund firms by assets and showed there is a clear negative rela- tionship between fees and performance: Generally, firms with low fees have a higher likelihood of above-average performance, while firms with high fees have below-average performance.(i) More expensive funds often do not generate better gross returns which would justify their higher fees. In fact, because fees and expenses reduce investors’ returns, funds with low fees and expenses tend to generate better net returns.
Low Turnover
Low turnover is a third attribute of the most successful managers. Just as low fees and expenses help managers outperform by reducing drag on gross performance, low turnover does the same. Turnover is the percentage of a fund’s invested assets that are traded each year, and a low turnover means a lower level of the trading costs that reduce net investment returns. Trading costs include not only the out-of-pocket fees and commissions paid to market intermediaries but also market impact because a large transaction can significantly affect the price of the stock being bought or sold.
Research by Roger Edelen and his co-authors of Shed- ding Light on ‘Invisible’ Costs: Trading Costs and Mutual Fund Performance(j) found a strong negative relationship between aggregate trading costs and fund returns.
According to the authors, “Sorting funds on the basis of their aggregate trading-cost estimate yields a clear mono- tonic pattern of decreasing risk-adjusted performance as fund trading costs increase.” Mutual funds in the lowest quintile of aggregate trading costs in Edelen’s study had average annual returns 1.78 percentage points higher than the highest quintile, highlighting the detrimental effect trading costs can have on performance.
Research shows active strategies with low turnover, especially when coupled with high active share, are more likely to generate long-term excess returns. Martijn
Excess Returns of U.S. Equity Mutual Funds
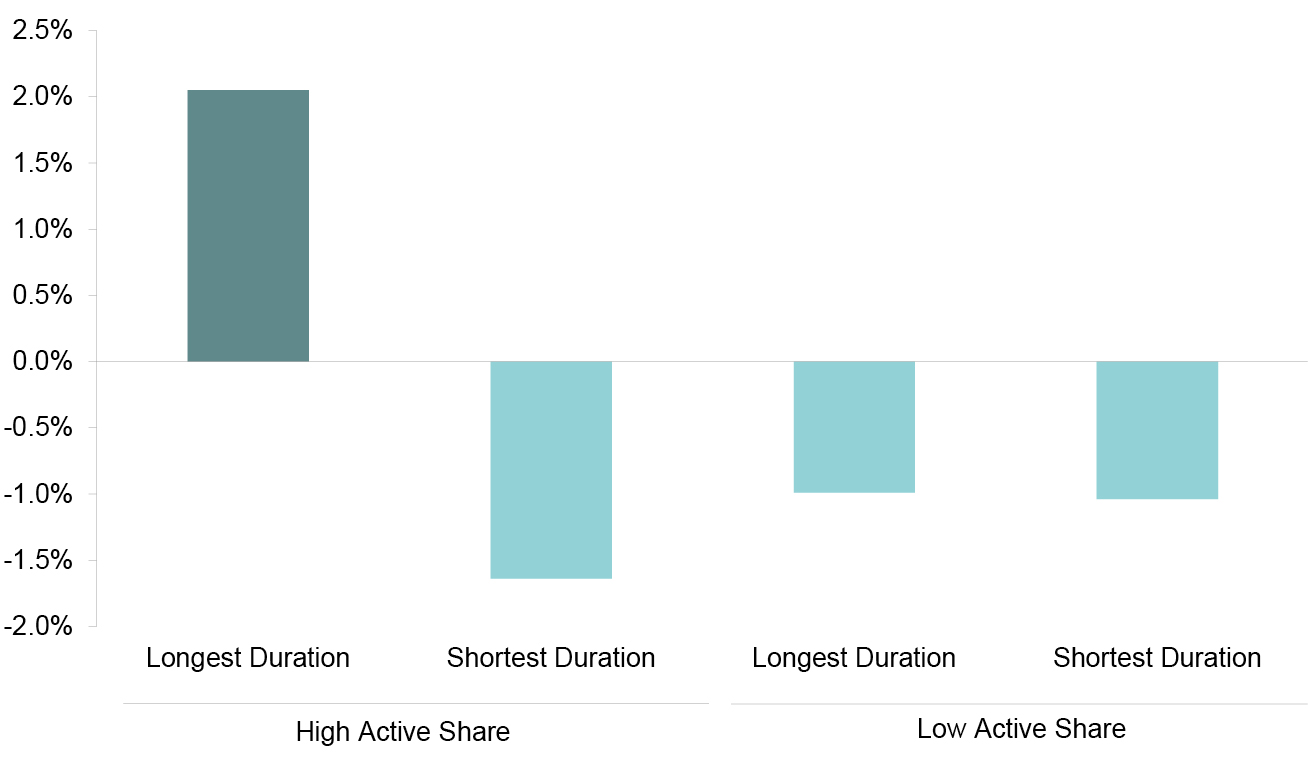
Source: Martijn Cremers and Ankur Pareek.
Cremers and Ankur Pareek(k) have studied performance in relation to holding duration (the length of time the manager holds a typical stock) and active share. They found that retail mutual funds that combined long holding duration with high active share outperformed on average after fees, thus demonstrating that the combination is more powerful than either attribute—high active share or low turnover—alone.
The threshold for U.S. equity mutual funds and insti- tutional investors to be classified in the lowest quintile of turnover (or quintile with the longest duration) in Cremers and Pareek’s study was an average holding period of more than two years. For both types of investors, the average holding period was approximately 1.4 years.
Low turnover helps boost ultimate investor returns in ways other than just lowering transaction costs: The lower a fund’s turnover, the more tax efficient the fund is likely to be. A high turnover rate not only means the fund incurs higher costs in implementing its strategy, it may also incur capital gains, which must be distributed to shareholders, who must then report the gains on their tax returns.
Avoiding the Risks in the Index by Considering Fundamental Value
A fourth attribute of successful active managers is managing risk. Critics of active management often focus on the average return of all active managers, pointing out
that index funds have higher average returns than the universe of active managers after fees. However, average returns are not the only consideration for a long-term investor: There is also the issue of risk. Active managers who focus on fundamental value have consistently generated higher risk-adjusted returns than index funds when risk is measured over longer-term horizons.
An index fund is not risk-managed: It contains all of the issues—and all of the risks—associated with an index, such as the S&P 500. While the index fund manager is obliged to invest in companies presenting a wide range of risks, an actively managed portfolio can seek to avoid the securities that embody the greatest risks. This creates a level of potential downside risk protection that is not provided by a passive investment in an index.
As of December 31, 1995, Morningstar’s U.S. large-cap value category comprised 156 active mutual funds. We compared these funds’ risk characteristics to those of the 52 funds that Morningstar classified as large-cap index funds at the time.(m) Using the returns of these active value mutual funds and large-cap index funds, we calculated CAPM alphas(n) (a measure of risk-adjusted return) for each fund by subtracting the risk-free rate and the return attributed to equity market exposure. Since the equity market beta depends on the return horizon used, the alpha also depends on the return horizon.(o) The following chart displays the average annual alpha, in basis points, for each group.
Annual CAPM Alpha (1995–2015)
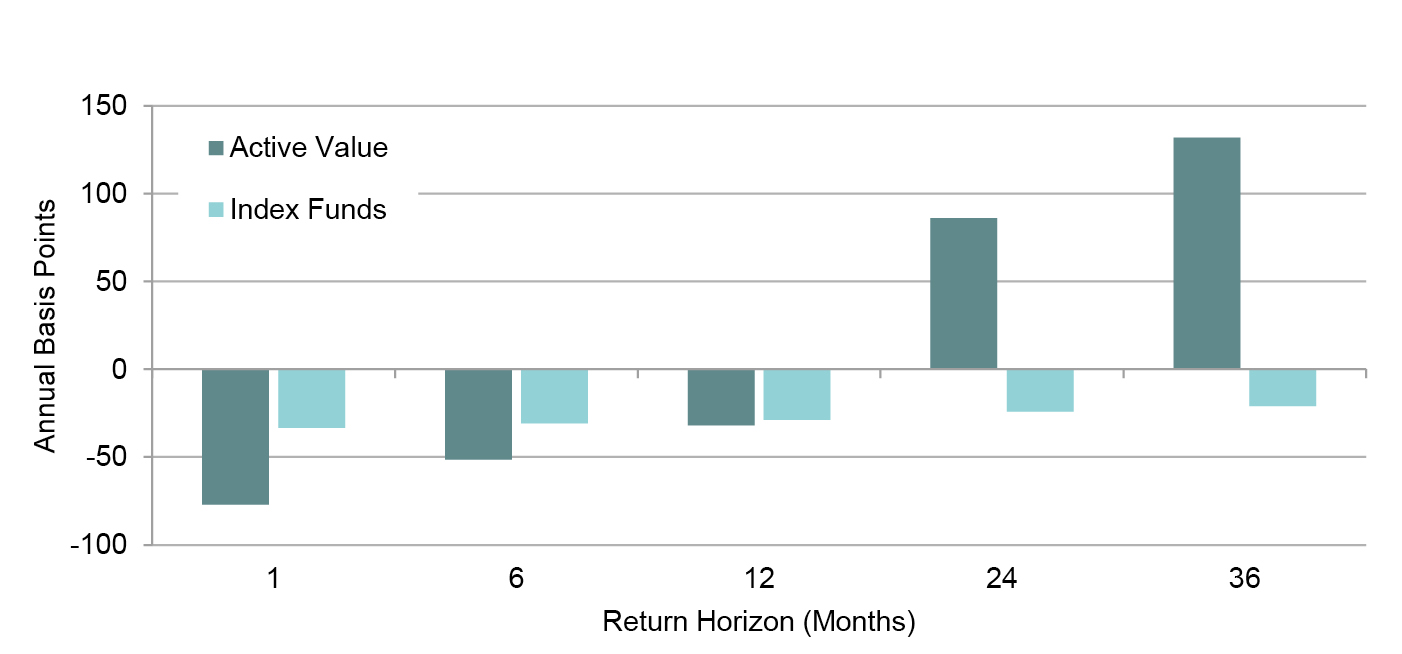
Source: Morningstar Direct.
When focusing on one-month return frequencies, active value managers show a negative annualized alpha of approximately one percent and index funds show a negative annualized alpha of less than half a percent. Both are roughly equal to the funds’ annual expense ratios.
However, as measurement horizons are increased to two or three years, active value managers’ risk-adjusted returns look increasingly attractive, and their alphas become positive while the alphas for the index funds remain negative. Lower long-term risk leads to higher risk-adjusted returns for active value managers.
In addition to the four portfolio attributes associated with active managers who outperform their benchmarks, there are also two attributes associated with the firms that outperform.
A Firm-wide Focus on a Core Competency
One of the two attributes associated with the successful active management firm is focus: Firms that are focused on specific strategies or approaches to the market have been shown to have an advantage in generating attrac- tive investor returns. A “focused” firm may well have a number of products, but rather than covering the entire investment waterfront, most of these funds concentrate on a narrow set of strategies, techniques, or asset classes. In his paper Why Focus? A Study of Intra-Industry Focus Effects,(p) Nicolaj Siggelkow found that U.S. mutual funds managed by firms with focused product offerings had higher returns than funds with similar investment objectives that belong to more diversified fund provid- ers. More focused investment managers have a higher probability of outperforming because they are focused around a core competency, such as pursuing a particular strategy or type of portfolio. This consistent approach allows for specialization, creating greater expertise and organizational alignment. Having a very broad range of disparate products is not necessarily beneficial to investment results.
Research by Vikram Nanda and his colleagues tells a similar story. In Family Values and the Star Phenomenon: Strategies of Mutual Fund Families,(q) they found historical- ly successful fund families with a small number of similar funds outperformed fund families with a broad array of offerings (by 2.5 percentage points per year).
The studies above suggest that fund families focused on their core competency are able to amass greater expertise in their area of focus than fund families with a more diverse range of strategies and approaches. Focused fund families are more likely to share information and strategies among member funds. This improves the depth and quality of the information that each fund has, and may result in less dispersion in fund results and better overall returns.
Close Alignment of Interests
A second attribute of successful active management firms is a high degree of alignment of interests between port- folio managers and clients. That alignment is typically measured by financial “skin in the game.” When the Securities and Exchange Commission (SEC) adopted regulations in 2004 requiring U.S. mutual fund managers to disclose the dollar range of securities they beneficially own in each fund they manage, the SEC noted that “a portfolio manager’s ownership in a fund provides a direct indication of his or her alignment with the interests of shareholders in that fund.”(r)
In Portfolio Manager Ownership and Fund Performance,(s) Ajay Khorana and his colleagues used reported owner-
ship ranges to conclude that mutual funds with managers who are personally invested outperform their peers by an average of 1.44 percentage points per year. Their research also showed that the level of managerial ownership affects future fund performance. They reported that
“For every basis point of managerial ownership, excess performance of the fund improves by about 3-5 basis points.” It would seem that this effect should be stronger for actively managed funds than for passive funds since index fund managers seeking to match the return and risk characteristics of an index by mirroring its composition are essentially technicians following a formula. Their de- cisions cannot be affected by their financial involvement in their funds.
THE IMPORTANCE OF STAYING FOCUSED ON THE LONG TERM
The research described above suggests that when you look beyond the 12-month horse race, there is potential to achieve positive long-term results by investing with a skilled active manager. However, after selecting such a manager, many investors go astray by overreacting to short-term results and losing sight of their long-term investment horizon: They become too active in managing their active managers.
U.S. Equity Mutual Funds: Returns Realized by Type of Fund (Net of Fees)
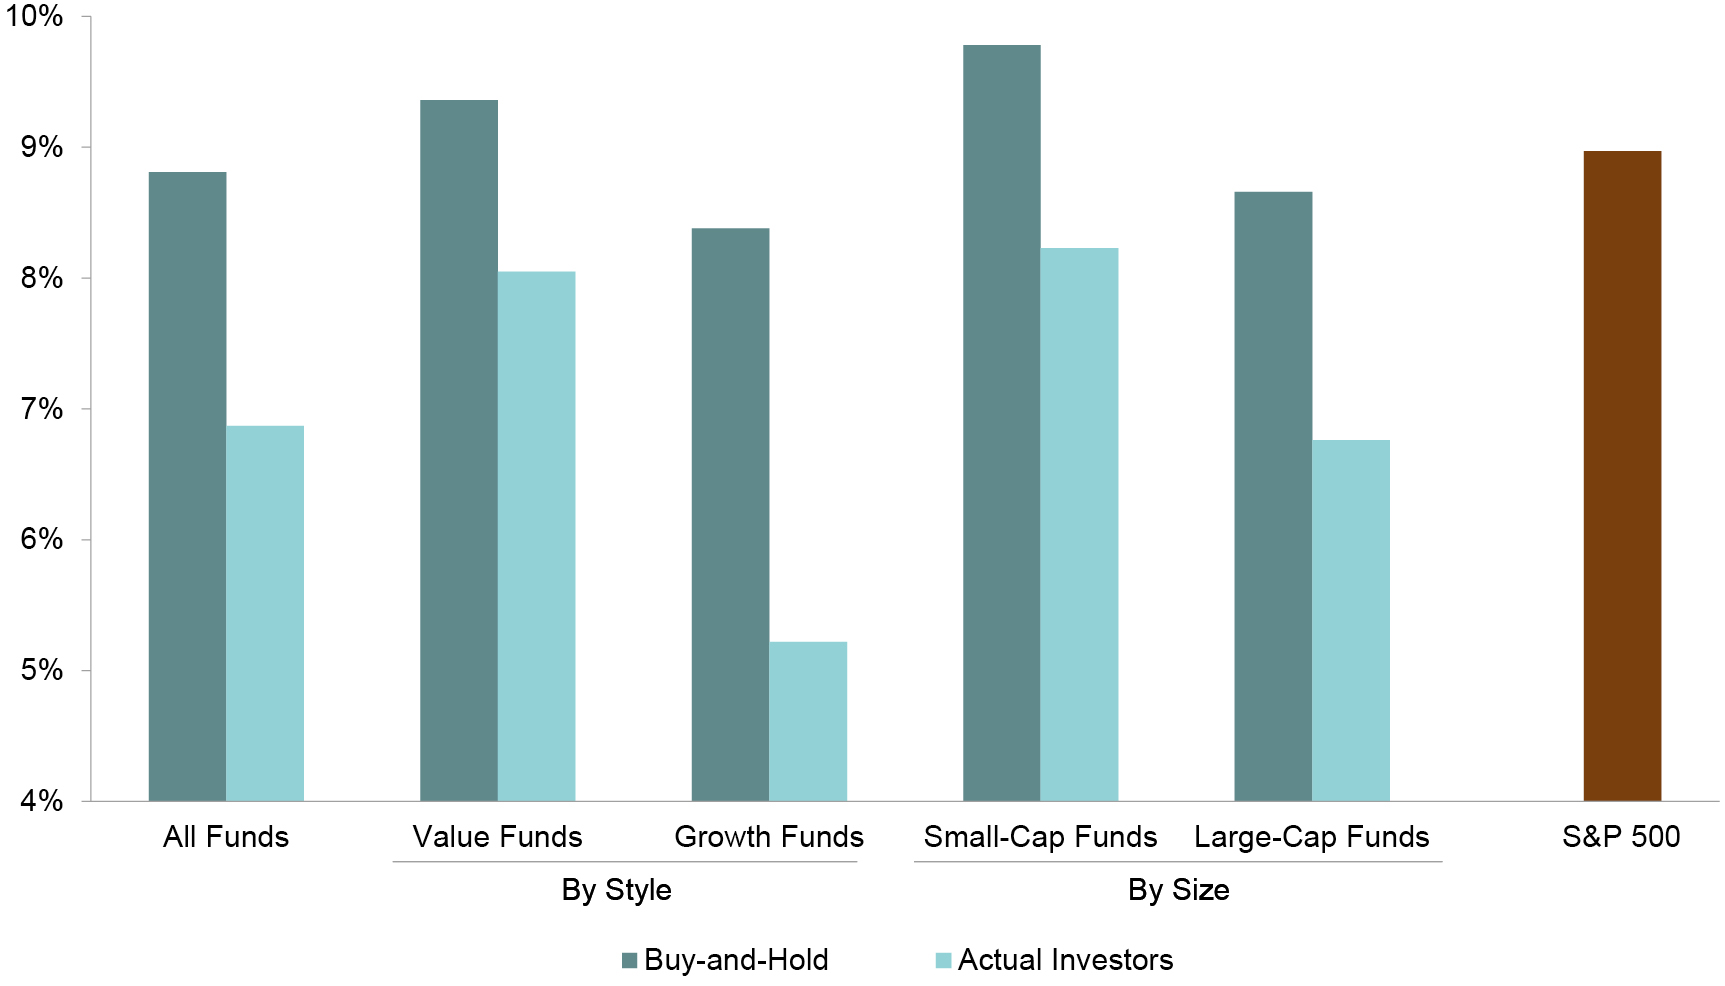
Source: Hsu, Jason, Brett W. Myers, and Ryan Whitby. “Timing Poorly: A Guide to Generating Poor Returns While Investing in Successful Strategies.”
Morningstar observed that because of poorly timed buy and sell decisions, over the ten years ending December 31, 2015, the average investor in U.S. diversified funds and international equity funds earned 0.7 and 1.2 percentage points less, respectively, per year than the average mutual fund’s published return.(t) Many investors jump into funds after a period of good performance and rush out on the heels of bad returns. But these efforts to capture returns only hurt their overall investment results.
Another study, Timing Poorly: A Guide to Generating Poor Returns While Investing in Successful Strategies,(u) also found that the returns investors actually earned were much lower than the return they would have earned buying and holding their funds through the 22-year period under analysis. As shown in the chart above, this held true across all fund types. Over the last 20 years, mutual fund investors appear to have given up approximately 2% per year because of ill-timed buy and sell decisions.
The rewards of active management are more likely to accrue to those investors who are prepared to take a long-term view and stand by an active manager amid the market’s constant twists and turns.
IN CONCLUSION
There is good reason to believe that experienced and disciplined active managers have the potential to generate above-average returns. That performance differential can accumulate into substantial incremental gains over time. To achieve those gains, however, investors must be patient and persistent; they must have a long-term investment horizon and they must have the discipline to stick with an active manager and an active strategy through the inevitable periods of underperformance.
In order to choose an active manager with the highest probability of achieving outperformance, investors can turn to academic research that has identified six charac- teristics of active investment managers that are strongly linked to long-term outperformance:
- High active share
- Low fees and expenses
- Low turnover
- Risk avoidance
- Firm-wide focus on a core competency Close alignment of interests
These attributes can be recognized ex ante, and they are enduring. While reaping attractive investment results from active management is by no means a sure thing, there are fruitful ways to identify skilled active managers and benefit from their services.
Disclaimer
Data has been obtained from sources considered reliable, but Dodge & Cox makes no representations as to the completeness or accuracy of such information. Opinions expressed are subject to change without notice. Before investing in any Dodge & Cox Fund, you should carefully consider the Fund’s investment objectives, risks, and charges and expenses. To obtain a Fund’s prospectus and summary prospectus, which contain this and other important information, visit dodgeandcox.com or call 800-621-3979. Please read the prospectus and summary prospectus carefully before investing.
1 Data was obtained from Bloomberg and Morningstar Direct and is as of December 31, 2015.
2 Data was obtained from Morningstar Direct and is as of December 31, 2015. Morningstar calculates active share based on the fund’s must recent holdings disclosure.
3 Cremers, KJ Martijn and Antti Petajisto. “How Active Is Your Fund Manager? A new measure that predicts performance.” Review of Financial Studies 22.9 (2009): 3329-3365.
4 Tracking error is the standard deviation of the difference between the portfolio and index returns, and measures how closely a portfolio follows the index it is benchmarked against.
5 Petajisto, Antti. “Active Share and Mutual Fund Performance.” Financial Analysts Journal 69, no. 4 (2013): 73-93.
6 Wermers, Russ. “Mutual Fund Performance: An Empirical Decomposition Into Stock‐Picking Talent, Style, Transactions Costs, and Expenses.” The Journal of Finance 55, no. 4 (2000): 1655-1703.
7 Carhart, Mark M. “On Persistence In Mutual Fund Performance.” The Journal of Finance 52, no. 1 (1997): 57-82.
8 Petajisto, Antti. “Active Share and Mutual Fund Performance.” Financial Analysts Journal 69, no. 4 (2013): 73-93.
9 Morningstar. “Top 20 Mutual Fund Companies by Assets.” Data as of June 30, 2016.
10 Edelen, Roger, Richard Evans, and Gregory Kadlec. “Shedding Light on “Invisible” Costs: Trading Costs and Mutual Fund Performance.” Financial Analysts Journal 69.1 (2013).
11 Cremers, M. and Ankur Pareek. “Patient Capital Outperformance: The Investment Skill of High Active Share Managers Who Trade Infrequently,” Working Paper. December 2015.
12 The graph displays risk-adjusted excess returns using the alphas from a five-factor regression as described in Table 3, Panel A of Cremers and Pareek (2015). The high and low groupings are the 1st and 5th quintiles when the funds are sorted by their active share and average duration.
13 Eligible funds were identified using the Morningstar Direct database, and the returns to each fund correspond to the lowest fee share class available. Data is as of December 31, 2015.
14 The “Capital Asset Pricing Model (CAPM) Alpha” can be interpreted as the portion of return that cannot be explained by exposure to the returns of the broad equity market. In our formulation, it is measured as the average excess fund return minus the fund’s beta multiplied by the excess return of the S&P 500. Both the fund and index returns are annualized and measured in excess of what would be earned by 3-month Treasury bills.
15 We estimate that the standard error around the estimate of the alpha for active value funds is approximately 15 basis points for the monthly return frequencies. In the case of monthly returns, the reported alpha is equivalent to the annualized intercept in the least-squares regression used in calculating the equity market beta. For longer return horizons, the reported alpha will differ slightly from the regression intercept as a result of the overlapping observations used.
16 Siggelkow, Nicolaj. “Why Focus? A Study of Intra‐Industry Focus Effects.” The Journal of Industrial Economics 51, no. 2 (2003): 121-150.
17 Nanda, Vikram, Z. Jay Wang, and Lu Zheng. “Family Values and The Star Phenomenon: Strategies of Mutual Fund Families.” Review of Financial Studies 17, no. 3 (2004).
18 SEC Rule S7-12-04, Disclosure Regarding Portfolio Managers of Registered Management Investment Companies.
19 Khorana, Ajay, Henri Servaes, and Lei Wedge. “Portfolio Manager Ownership and Fund Performance.” Journal of Financial Economics 85, no. 1 (2007): 179-204.
20 Kinnel, Russel. “Mind the Gap 2016.” Morningstar, June 2016.
21 Hsu, Jason, Brett W. Myers, and Ryan Whitby. “Timing Poorly: A Guide to Generating Poor Returns While Investing in Successful Strategies.” The Journal of Portfolio Management 42, no. 2 (Winter 2016): 90-98.